
Global equity markets posted a strong start to 2021, with global indices approaching record highs and many individual markets approaching or surpassing pre-pandemic records.
Positive economic data and accelerating growth ignited inflation expectations. This was reflected in a steepening in yield curves as longer bond yields surged back to levels last seen in February 2020 (pre-pandemic).
Even so, central banks, led by the US Federal Reserve, pledged to keep interest rates near zero until the pandemic’s damage is undone and there is a substantial recovery in labour markets.
Developed equity markets gained more than 6% over the quarter (in Australian dollar terms), bringing their gains over the full 12 months to nearly 26%. The MSCI All Country World index approached record highs in late March.
The Australian share market, as measured by the S&P/ASX 300 index, rose a little over 4% in the March quarter, bringing its 12-month gains to above 38%, although it remained about 1.5% shy of the record high struck in February 2020.
As in late 2020, value stocks (companies with low market valuations relative to the book value of their assets), were standout performers globally in the first quarter of 2021. Energy and Financials companies, beaten down by the enthusiasm for tech during the pandemic, led the revival. As lockdowns ended, Consumer Discretionary stocks were also in favour. Information Technology was one of the poorer performers during the quarter.
The small cap premium (the extra return smaller companies deliver in aggregate compared to large companies) was positive globally over the quarter, although the Australian market – which led the small cap revival in 2020 – bucked the trend.
In emerging markets value outperformed growth and small eclipsed large. Real Estate Investment Trusts (REITs) continued the recovery experienced in late 2020, which followed four consecutive quarters of losses. However, Australian REITs underperformed their global counterparts.
The story in fixed interest markets globally in the March quarter was the steepening in yield curves, with a substantially negative term premium. The global bond market fell 2.5% in the quarter, its worst quarterly result since 1994.
Currencies were mixed over the quarter. The Australian dollar strengthened against the NZ dollar, Japanese yen and Euro, while weakening against the US dollar and British pound. When measured over the full year however, the AUD made broad gains.
What Dominated the News
The following news summary is not intended to explain the markets’ performance in the quarter, but to provide some perspective about what dominated headlines:
January
- Supporters of President Trump Attack US Capitol, Leaving Five People Dead
- Joe Biden Inaugurated as 46th President of the US, Pledging Return to Unity
- Global Death Toll from COVID-19 Passes 2M; Total Cases Tops 100M
- Biden Pledges Full-Scale Effort Against Pandemic; Returns US to Climate Deal
- GameStop Becomes Centre of Battle Between Wall St and Small Investors
February
- Military Coup in Myanmar Removes Aung San Suu Kyi from Power
- Winter Storm in US Kills at Least 70 People; Causes 9.7m Power Outages
- Trump’s Second Impeachment Trial Opens with Images of Capital Riot
- NASA Rover Perseverance Lands on Mars; Searching for Lifeforms
- Facebook Takes Down News Pages in Australia Over Media Code
March
- Biden’s $1.9tn COVID-19 Stimulus Bill Wins Final Approval
- US Bond Yields Surge to One-Year High Amid Inflation Fears
- Mass Protests in Australia in Support of Sexual Assault Victims
- North Korea Fires Two Ballistic Missiles in Challenge to Biden
- Spectators from Overseas Banned from the Tokyo Olympics in July
Balanced Portfolio Movements
With Sharemarkets bottoming just before the end of March 2020, the year to 31 March 2021 represents the first full ‘post pandemic correction’ 12 month period. As such, one year returns are much higher than long term expected returns and perspective should be taken when assessing performance as they only capture the ‘bounce-back’ period, and not the market collapse that went before.
History shows us that the average long-term return for a portfolio is rarely the same as the actual return in any given year, and that periods where returns are much lower are often followed by periods where returns are much higher (as we have just experienced). To illustrate this dynamic, the chart below shows the annual returns over the last 30 financial years for Australian Shares and a ‘60/40’ mix of growth and defensive assets overlayed with the average return across that period for each strategy.
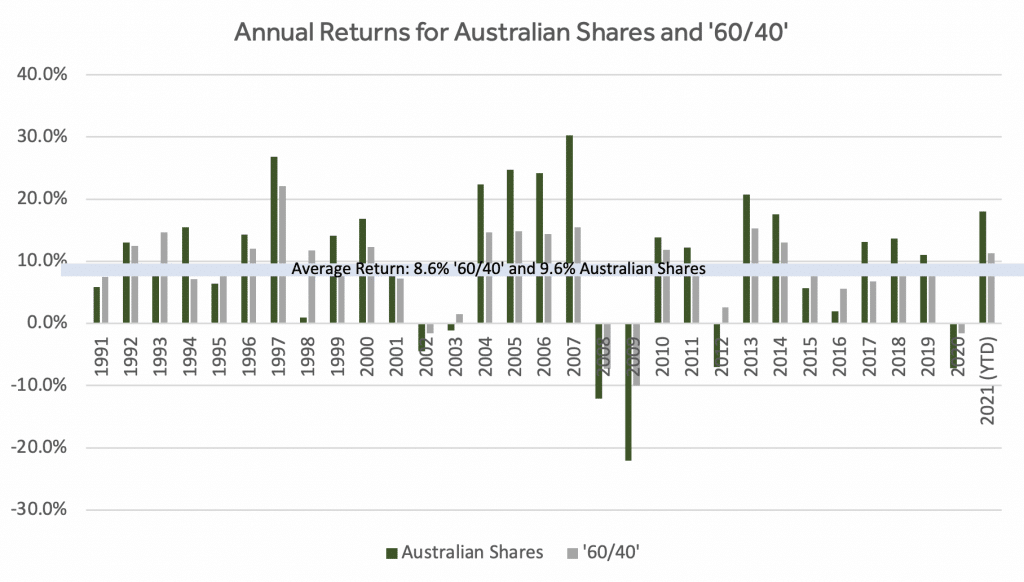
Source: Minchin Moore
The year ended 31/03/2021 presented many opportunities for systematic portfolio rebalancing between asset classes (i.e. topping up hardest hit asset classes, and selling down those most resilient). As asset prices adjusted to changing expectations around future earnings and risks to economies and financial markets the outcome of rebalancing switched from adding to underweight growth assets to reducing exposure following strong price movements.
Our ‘Industry Equal Weight’ approach to the selection of direct Australian shares continued to provide diversified sources of returns, being overweight several industry sectors that performed well, such as Information Technology, Energy, and Consumer Discretionary, and managed to keep up with the S&P/ASX 200 Index even though the exposure to the larger sectors (Financials and Materials) was less than their market weight. The ongoing rebalancing between stocks also played well as profits were taken from holdings that performed well leading into the pandemic, such as Health Care, Consumer Staples, and Utilities and deployed into the underperforming sectors such as Financials, Energy, and Consumer Discretionary when their valuations were depressed.
The ‘Value Style’ of investing (overweighting cheaper stocks and underweighting expensive ones) continued its resurgence over the quarter, and this supported returns across multiple asset classes and strategies, including Australian Large and Small Shares, International Shares, and Emerging Markets as value stocks outperforming the broader market by around 5% in Australia and 5% in international markets over the March quarter.
Our higher exposure to small companies delivered mixed results in the March quarter, with Australian small caps underperforming the broader market by around 2% in Australia, although annual returns materially exceeded that of large caps. Bond yields rose (prices fell) during the quarter (see chart below) delivering the worst quarterly returns in 30 years for the benchmark. Yields rose on expectations of higher future inflation following the significant fiscal and monetary policy initiatives deployed since the onset of the pandemic. Bond portfolios with more exposure to interest rate duration are more heavily impacted in the short term when yields rise (just as they benefit more in periods when yields decline).
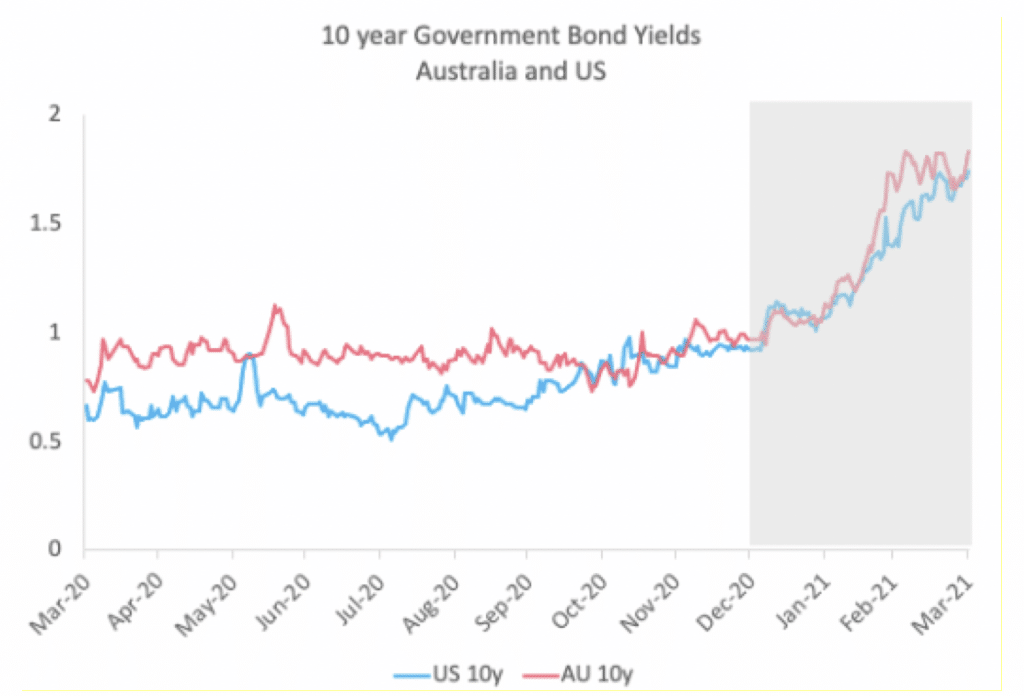
Source: Principia Investment Consultants
The role of bonds in a low and rising interest rate environment
Right now, the yield to maturity (the interest rate you get) on the Bloomberg Barclays Global Aggregate Bond Index is a little over 1%.
To be clear, this means that the expected return on the defensive portion of your portfolio is arguably the lowest it has ever been. This has left many investors wondering what role bonds should play in a diversified portfolio. Should bonds remain in the mix? Or is there a better way?
These are natural questions for investors to ask. Afterall, most of us have a significant portion of our portfolios invested in cash-linked investments like bonds and credit.
Unfortunately, there are no easy answers. Whilst the expected returns are very low, the alternative – allocating all our capital to the growth or ‘risky’ part of their portfolio, really isn’t a sensible option. It is simply more risk than we need or can practically tolerate.
The secret to finding solace in the face of this challenging dynamic is to understand the role each component part of your portfolio plays in the working whole. That is, to take a top -down, rather than bottom-up perspective.
Let us explain….
Many investors make the mistake of assessing each investment within their portfolio. This approach involves building a portfolio from the bottom-up, considering the expected return and expected risk of each potential investment in isolation. If the expected return/risk metrics measure up, then investment is included in the portfolio.
Whilst this approach may appear prudent on the surface, the problem is that you can end up with a group of investments that all move in-sync, offering little protection if the drivers of return for that group of investments turns sour.
There is simply nothing worse than having every investment in your portfolio turning down at the same time. This phenomenon leaves investors with no good choices. Either ride the wave down, or sell investments when they are down.
A better way to build a portfolio is from the top-down. This involves, considering the role each component part plays in the working whole. Further, it involves carefully considering the correlation between component investments.
Investments that have low correlation provide much more diversification benefit than those that are closely correlated. Or put another way, the objective here is to ensure that all your investments are all behaving differently, rather than singing in concert.
A top-down approach involves accepting that the returns from the various component parts will not all be good all the time. Bonds will not always show good returns, and neither will equities, but that is ok, so long as they both show good returns over the full cycle.
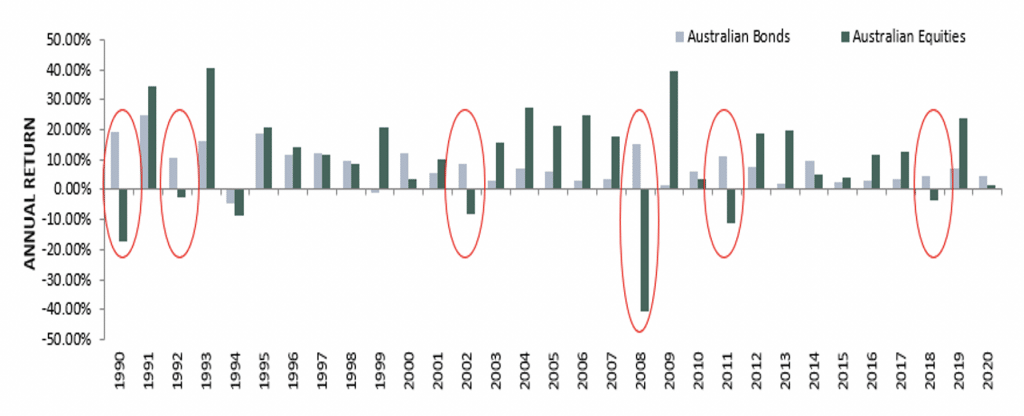
When building a diversified portfolio, the most useful interplay (or correlation relationship) is that which exists between bonds and equities. It is one of the very few relationships that consistently shows negative correlation at the times when you need it most (when equities are crashing). See the chart below.
Despite the low expected returns from bonds and cash, the expected real return (taking account for inflation) for a 60/40 portfolio may not be much lower right now than it normally is. History shows that often when returns from the defensive parts of the portfolio are lower than long term trend, the returns from the growth parts of the portfolio are higher than long term trend. And there is good economic basis for this – growth assets often deliver higher than average returns during the period when interest rates are low (as the valuation of future cashflows increases when the discount rate is lower). We’re seeing this effect at present with returns for Growth Assets (such as Australian Shares) for the financial year to March (18%) almost double that of the long-term average annual return (10%), resulting in the 60/40 portfolio return (11%) also being higher than its long-term annual average (9%).