By Andrew Marchant, Minchin Moore Chief Investment Officer (CIO) & Partner, with thanks to Dr Steve Garth, Industry Veteran, Minchin Moore Investment Committee Member.
Key Points for the Quarter
- A very solid financial year for global shares (up 20%), with US tech giants dominant
- Australian stocks rose 12% for the year, led by Financials and Information Technology
- June quarter more subdued, with Australian stocks down marginally and global stocks up
- While large growth dominated in 2023/24, value & small caps have recently revived
- Annual returns from defensive assets that benefit from higher interest rates were the highest in a decade in 2023/24
- Diversified portfolio returns were higher than long term averages
- Caution crept in during the final quarter amid worries about sticky inflation
- The US Federal Reserve is signalling a rate cut in September; the RBA is on hold
A bumper financial year, in which developed market shares posted a gain of 20% and Australian shares surged 12%, ended in a more subdued fashion in the June quarter. Big picture, markets seemed to be in a holding pattern, waiting for economic skies to clear.
Both the Reserve Bank of Australia and the US Federal Reserve kept their respective benchmark rates on hold, but their messages diverged. In the US, inflation fell in line with expectations. In its last meeting, the Fed said it expected to cut rates once this year but foresaw four reductions in 2025 instead of three.
Inflation has been proving stickier in Australia, with the tone from the RBA more hawkish. That is because official inflation readings came in higher than expected for three straight months. This sent bond yields and the Australian dollar higher as markets lifted the odds on the Australian central bank resuming raising official cash rates.
Apart from the US, there has been a slight pullback in equities since the highs posted at the end of March. Even so, dispersion in sector performance again highlighted the value of diversification. Value, or low relative price, stocks outperformed growth stocks in Australia, while more recently we have seen a resurgence in small cap stocks in the US.
This is a change from most of the financial year, in which the US market was driven overwhelmingly by the so-called ‘Magnificent Seven’ of technology leaders, including Apple, Nvidia, Tesla, Microsoft, Amazon, Alphabet (Google) and Meta (Facebook). As the talisman of the artificial intelligence boom, Nvidia is up 190% in the past 12 months and now makes up a stunning 7% of the broad US market. While Nvidia has shown significant earnings growth, the question for investors might be when and how much of the benefits of AI will flow into positive economic returns for the broader economy.
Inflation & Interest Rates
More than two years into the steepest policy tightening cycle in decades, central banks are grappling with how fast to unwind the policy. Australia and the US remain in a holding pattern, with the RBA now contemplating one more rate increase. Stock markets are consolidating as they participants begin to accept that taming inflation is not going to be as easy as they previously anticipated.
It marks a contrast with the start of 2024, when there was a collective sense of euphoria about interest rates moving down soon. In Australia, some commentators were predicting that the RBA would start cutting by June, with at least two rate cuts forecast for this year. The US market was even more excited, predicting that rates would come down by 0.75% by the end of this year.
But price pressures have proved stubborn, a strong US dollar has hampered developing nations, and geopolitical tensions have added uncertainty to the post-pandemic economic recovery. In Australia, the monthly consumer price index rose to 4% in May – its highest level so far this year – overshooting expectations and well above the RBA’s 2% to 3% target.
This prompted some economists to consider the possibility that the RBA may need to lift rates further to pull inflation towards the target zone. Money markets modestly raised the probability that the bank will lift the cash rate by a further 0.25% to 4.6%.
In the US, recent data showed that the US jobs market remained buoyant, while recent purchasing managers indices pointed to an acceleration in US growth. Share market investors became anxious about rising bond yields as rate cut expectations were pushed back again, although more recently the Fed has signalled it may ease policy in September.
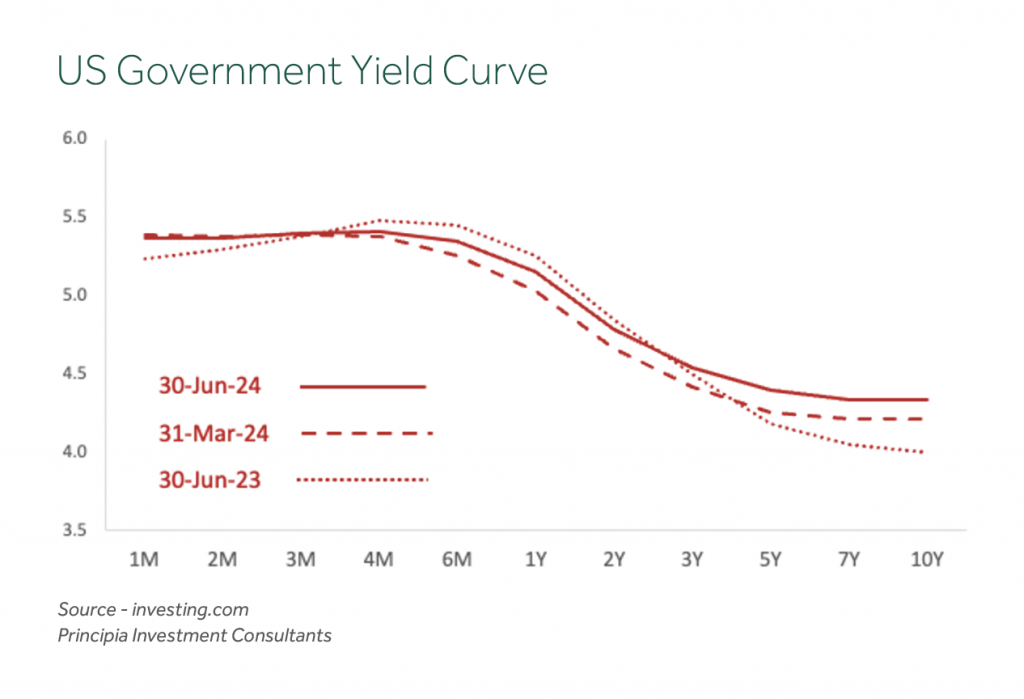
Yields on longer maturity bonds have been rising over the course of this year. However, the chart below shows the bond market is balancing the dual roles of pricing in higher-for-longer rates, while countering weaker equity markets with a drop in yields from the end of April through to June.
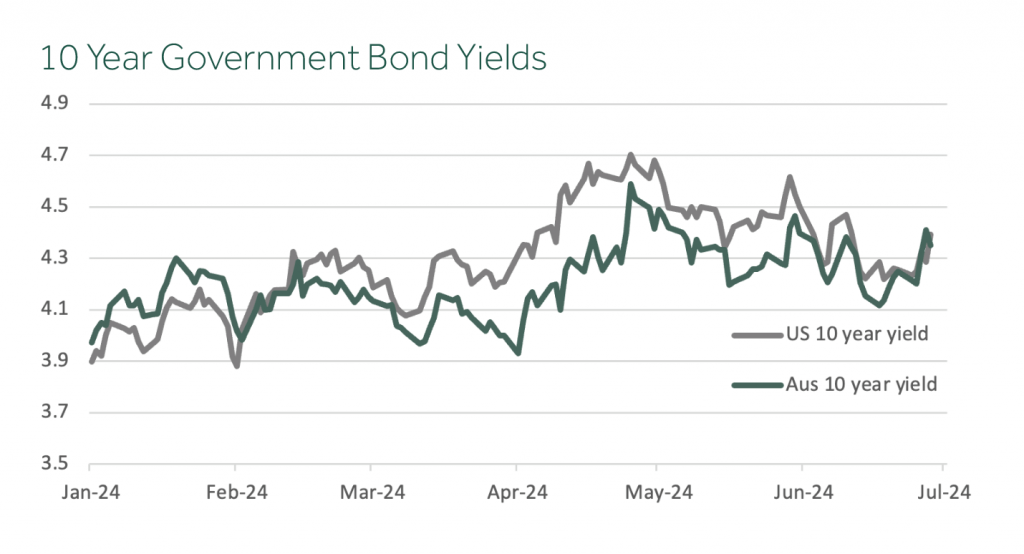
Futures markets by the quarter-end were pricing in expectations that the Fed would make only one 0.25% rate cut this year, from its present target range of 5.25% to 5.5%. In Australia – notwithstanding the heightened risk of an interest rate rise – economists have pushed back the timing for the RBA’s first interest rate cut until sometime in 2025.
What does all this mean for Australian investors? It is clear the economy is slowing. While unemployment remains low, the data still points to low GDP growth in the coming quarters. Prices remain elevated, and businesses and individuals are feeling the pressures of the higher cost of living. However, over a longer horizon, inflation is receding – although the economy is not slowing as quickly as the RBA would like – and so rates may continue to remain higher for longer.
However, the economy and the stock market are not the same thing. Bond and equity markets price in new economic data instantaneously and constantly reset expectations on where prices will be in the future. While equity markets have been more sluggish and risk appetites have eased a little in recent months, markets are still significantly positive on a year-to-date basis.
For the bond market, the post-pandemic inflation shock and rate-hiking cycle have produced a reset in higher yields. This offers the prospect of a positive multi-year outlook for fixed interest as inflation recedes. Furthermore, as we have seen, bonds have returned to their usual place as a safe-haven asset and are well positioned to protect portfolios in times of risk aversion.
Portfolio Performance
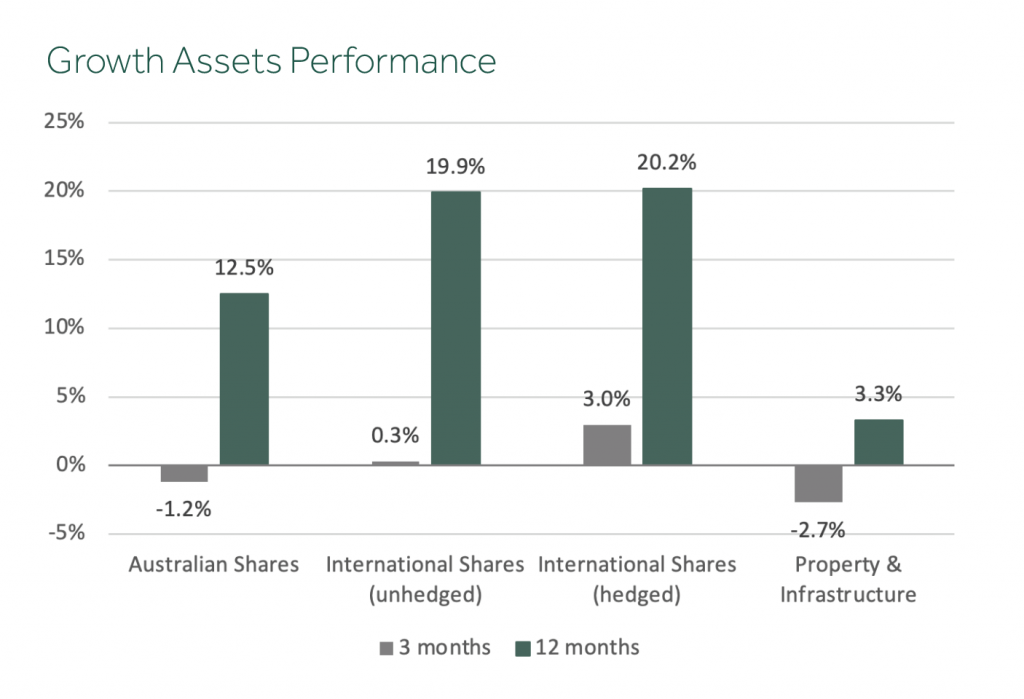
After an impressive rally in the previous two quarters, financial markets were more subdued in the three months to June. Returns were slightly negative for Australian shares (-1%) and international property and infrastructure (-3%). But international shares were modestly higher (+2%). Among defensive assets, bonds were flat, while cash and hybrids were up slightly (+1%).
Zooming out, however, 12-month returns from all the major asset classes were positive, while portfolio returns for the financial year were higher than long-term averages. In equities, developed markets were up a solid 20% for the year, led by the US and more particularly a handful of tech stocks seen benefiting from the Artificial Intelligence boom.
The Australian market also has had a strong 12 months, returning just over 12%. That is higher than the average financial year return for the last 30 years. Property & Infrastructure (+3%), Bonds (+3%), Hybrids (+6%), and Cash (+4%) all delivered positive returns for the year.
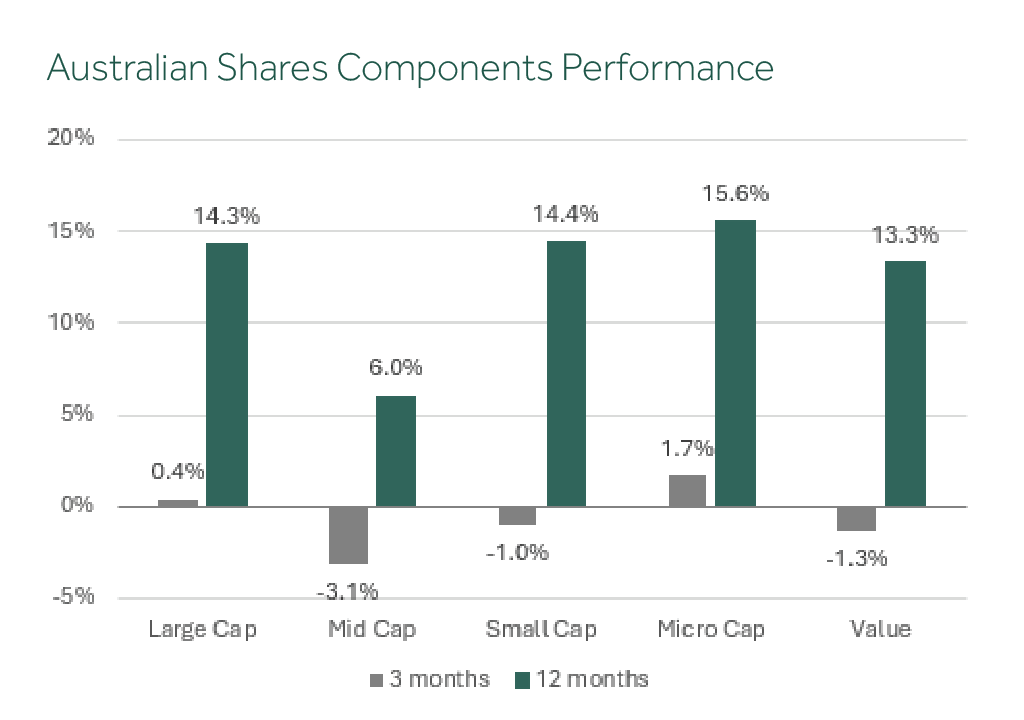
But it is important to understand that ‘the market’ is more than the index. Within Australian shares, for instance, we can combine three broad components (or ‘factors’) to construct a well-diversified aggregate portfolio:
- Large companies (for broad market exposure),
- Value companies (those with cheaper relative valuations), and
- Mid/Small/Micro-Cap companies (those expected to deliver higher returns over time).
The evidence shows that each of these components behaves differently through time, and each plays its own roles in performance and risk management. Through the investment cycle, we expect each to experience a different sequence of return. This opens up opportunities for investors to top up the underperforming components and take profits from the components that are performing well.
We know that the Australian market is top-heavy with banks and miners. So we seek to manage risk and improve diversification in large caps by allocating equally across the industry sectors, rather than adopting the traditional market-weighted approach. This takes advantage of the less-than-perfect correlation between sectors, which can be seen clearly in the table below.
The top and bottom two sectors for each quarter of the financial year have been highlighted, the top ones in green and the bottom in red. You can see that the annual returns to June 2024 ranged from as little as -5% for Consumer Staples to +29% for Financials. By the way, this is almost a complete reversal of the previous year’s performance for these two sectors. Likewise, after leading the way in fiscal 2023, Energy, Materials, and Communication Services were more muted in the year just ended.
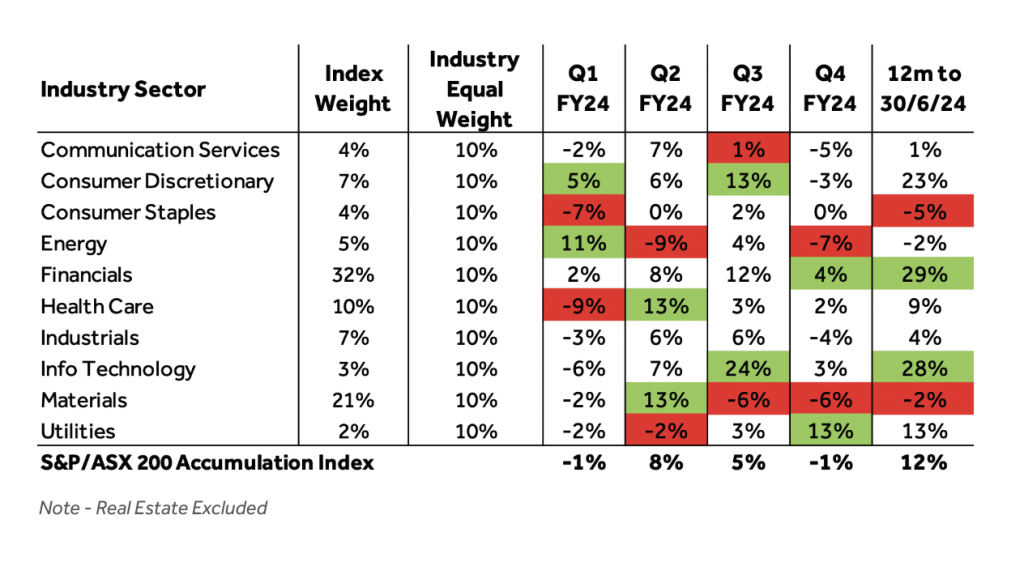
After Russia’s invasion of Ukraine, we saw fossil fuel-linked sectors in Energy and Utilities power ahead following several years of decline. However, that divergence between traditional and sustainability-focused portfolios narrowed in the past year as Energy and Utilities were relatively weaker, while ‘cleaner’ (low carbon-footprint) sectors such as IT, Financials, and Consumer Discretionary led the market. Having said that, we still expect long-term returns from each approach will be similar, given our consistent underlying investment philosophy, but this again highlights the virtue of diversification.
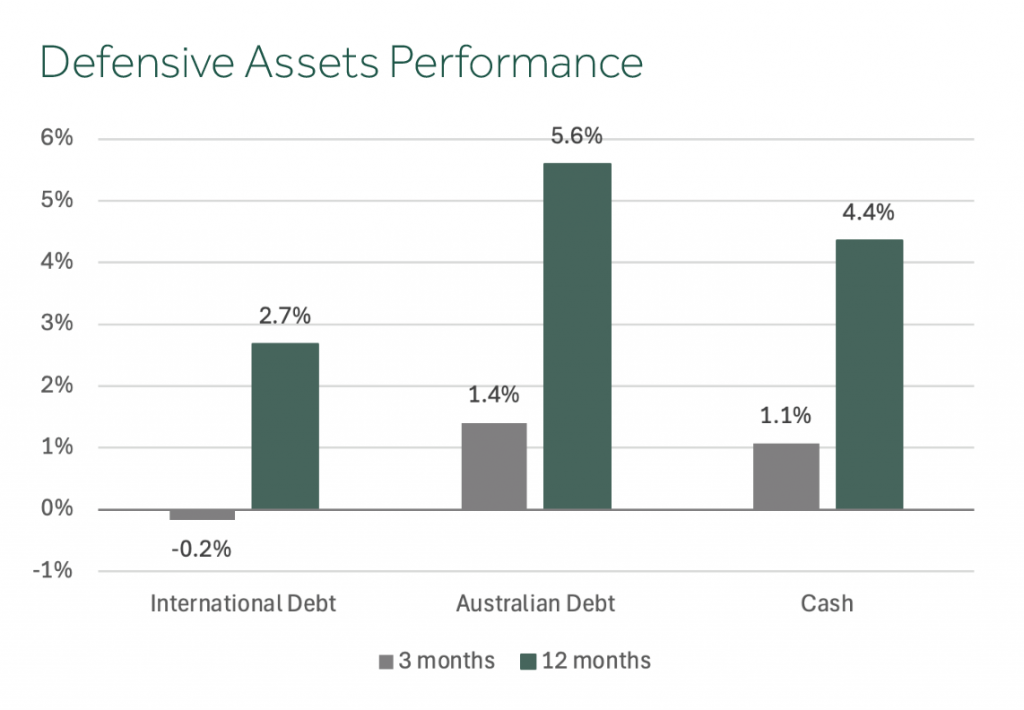
Within defensive assets, international debt (-0.2%) posted a small negative return for the quarter. The annual return was a healthier +2.7%. Australian debt (hybrid securities) posted a small positive return for the quarter (+1.4%) as did cash (+1.1%), both of which are benefitting from higher interest rates. Annual returns for these asset classes were the highest in a decade, reflecting the benefit of higher interest rates, and in line with long-term average returns.
The US yield curve at June 30 was little changed from where it was three months before, reflecting markets’ expectation that Fed rate cuts would not begin until later this year.
For diversified portfolios, performance for the June quarter ranged from -0.2% for 50/50 growth/defensive allocations to -0.5% for 85/15 portfolios.
Annual returns for diversified portfolios to the end of June this year were higher than long-term averages and ranged from +8.0% for 50/50 portfolios to +12.2% for 85/15 portfolios.
Summary
In summary, while the June quarter was subdued overall for asset class returns, the full financial year was extremely positive. Spreading risk across sectors, countries and asset classes paid off, highlighting the benefit of a systematic and diversified investment strategy.
While uncertainties over economic growth, inflation, interest rates and geopolitics continue to beset investors heading into the second half of calendar 2024, the evidence-based and disciplined approach embraced by Minchin Moore remains the best protection against the unexpected.