By Andrew Marchant, Minchin Moore Chief Investment Officer (CIO) & Partner, with thanks to Dr Steve Garth, Industry Veteran, Minchin Moore Investment Committee Member.
The US and Australian equity markets hit record highs at the end of the September quarter as news of moderating inflation and a global move to lower interest rates overshadowed geopolitical uncertainty and a brief breakout in volatility in August.
Contents
- Major Themes
- Markets at a Glance
- News Highlights
- Financial Markets Overview
- Portfolio Performance
- Lessons Learnt: Volatility and Discipline
Major Themes
A global shift to lower interest rates amid moderating inflation was a major theme in the September quarter. Central banks in the US, Canada, the UK and NZ were among those to ease policy. The RBA declined to join the trend, arguing inflation was still too high and coming down too slowly. The Bank of Japan was also an exception, hiking rates to 0.25% in July after a decade of super-easy policy. This led to major volatility in early August amid an unwinding of the yen ‘carry trade’. The Japanese equity market posted its biggest one-day fall since 1987. Aside from monetary policy, geopolitics loomed large through the quarter amid the US and other major elections, the ongoing war in Ukraine and a major escalation in tensions in the Middle East. Amid all this, Australian and global equities still delivered very positive returns in the quarter and were up in double-digit terms over the past 12 months to reach record highs, while bond yields declined sharply amid the downward shift in inflation.
Markets at a Glance
| Quarter | 12 Months | |
| Australian Shares | ||
| International Shares (unhedged) | ||
| International Shares (hedged) | ||
| Property and Infrastructure | ||
| International Debt (Bonds) | ||
| Australian Debt (Credit) | ||
| Cash |
News Highlights
July
- In UK election landslide, Labour Party ends 14 years of Conservative rule
- French election yields deadlock as leftist alliance surges and far right falls short
- China’s GDP growth slows to 4.7% in second quarter, missing forecasts
- Trump shot in ear in assassination bid at campaign rally; shooter killed
- Biden ends faltering re-election campaign, backs Harris as Democratic nominee
August
- Bank of Japan rates shift forces investor reassessment of carry trade
- Japan’s Nikkei falls 12% in biggest one-day rout since 1987 Black Monday crash
- Volatility Index ‘fear gauge’ hits highs last seen in COVID pandemic in 2020
- US inflation falls below 3% to three-year low, paving way for Fed rate cut
- Ukraine’s incursion into Russia’s Kursk region catches Kremlin by surprise
September
- ECB cuts rates for second time in three months as growth and inflation slow
- US Federal Reserve signals end to inflation fight with sizeable half-point rate cut
- S&P 500 closes at record high after Fed makes jumbo cut to US interest rates
- China unveils aggressive policy stimulus amid severe economic slowdown
- Middle East tensions surge as Israel hits Hezbollah targets in Lebanon
Financial Markets Overview
Global equity and bond markets posted solid returns over both the September quarter and the last 12 months despite outbursts of volatility, constantly shifting sentiment over inflation and interest rates and ongoing geopolitical uncertainty.
Even as central banks in major economies began to cut interest rates in the most recent quarter after more than two years of tightening monetary policy, market participants were torn between celebrating lower rates and worrying about the growth implications.
News in late July of the Bank of Japan’s first interest rate hike in 17 years came just as the market gained confidence that the US Federal Reserve would make an initial rate cut in September. This generated a significant upsurge in volatility in early August.
Japan’s Nikkei stock average fell 12% in a single session, its biggest one-day fall since the Black Monday crash of 1987. This was put down to a reversal of the so-called yen ‘carry trade’ where participants borrow in a low interest-rate currency and seek yield elsewhere.
This brief episode followed an extended period of low volatility in markets. Hedge funds and other trend-following funds that had been betting via the options market on a continuation of calm conditions were forced to sell, which exacerbated the volatility.
Within weeks, however, the US S&P 500 had returned to record highs, while the Nikkei had recovered a significant proportion of the August losses, though remained short of July’s all-time peak. The Australian market, as measured by the S&P/ASX 200, reached a record high late in the quarter.
The shift in sentiment could be sourced to greater confidence that central banks globally had broken the back of the inflation upsurge that emerged from the end of the pandemic and the energy supply crunch sparked by Russia’s invasion of Ukraine in 2022.
The Bank of Canada led the trend to lower rates, starting in June and with three moves to date. The European Central Bank followed shortly after in June and September, while the Bank of England adjusted rates down from a 16-year-high in August.
But the most eagerly awaited move was from the US Federal Reserve, which responded to inflation moving back towards its target by announcing a jumbo rate cut in September of half a percentage point and flagging more to come. Markets were priced for another move in November, although perhaps only a quarter of a percentage point next time.
The Reserve Bank of Australia remained an outlier as of late September, having kept its official cash rate at 4.35% since November last year. Despite pressure from the federal government to take its foot off the brake, the RBA said inflation locally was still too high and not coming down fast enough.
A concern for Australia is China where a weak property market has been dragging on growth and hitting household wealth. Defying trends elsewhere, the country’s equity market has halved in value in less than three years. In late September, China’s central bank unveiled its biggest stimulus since the pandemic in an effort to pull the economy out of deflation and back towards the government’s growth target.
As equities in other major markets recovered from their August swoon, yields on government bonds in many economies trended lower as policy rates declined and as inflation expectations shifted lower, although the US Treasury curve (from two-years to 10-years maturity) became normally shaped for the first time in two years.
Ahead of November’s US presidential election in November, geopolitical concerns percolated. The major event in Washington was when President Biden, under pressure from his Democratic Party, belatedly decided not to contest the 2024 poll and passed the baton to his deputy, Kamala Harris. Within weeks, Harris had narrowed the polling gap with Republican challenger Donald Trump.
With Trump widely expected to cut support to Ukraine and force a negotiated settlement with Russia should he win in November, Ukrainian President Volodymyr Zelenskiy pleaded with Washington and its partners to continue funding the effort and claimed the end of the war was near. In the Middle East, meanwhile, the threat of a wider regional war emerged as Israel launched air strikes against Hezbollah in Lebanon, shifting its focus from its near year-long war against Hamas in Gaza. The unrest supported oil prices, which had been trending lower amid global growth concerns.
Portfolio Performance
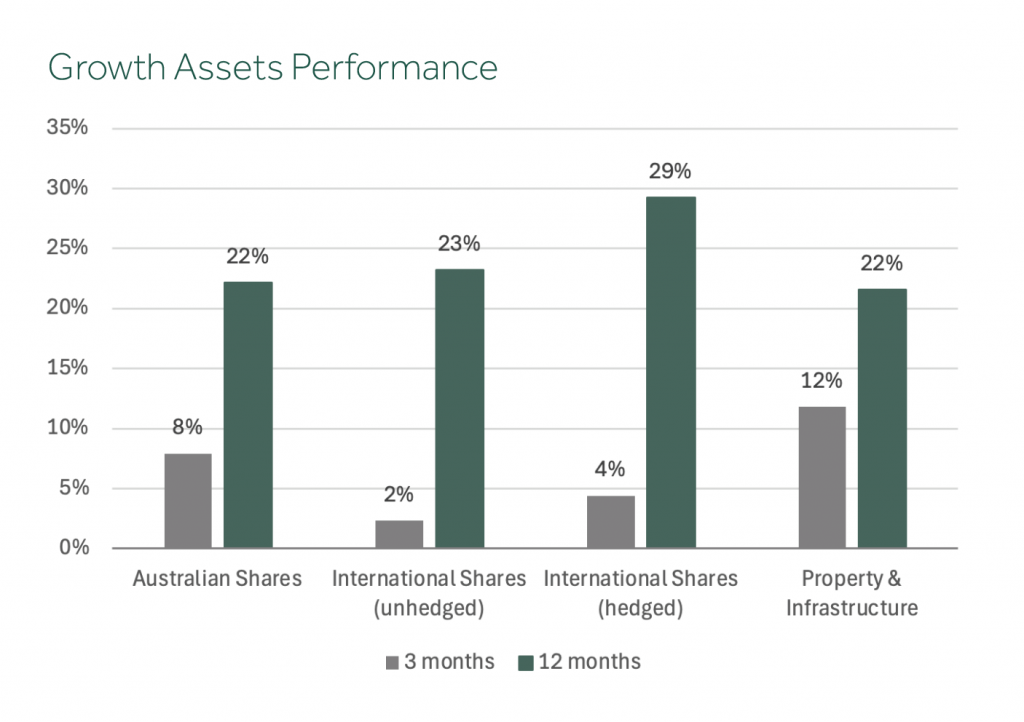
All financial markets posted positive returns in the three months to September, driving annual returns above long-term averages. Property & Infrastructure (+12%) led the way as investors reacted to lower bond yields. Australian shares (+8%) and International Shares (+3%) also moved higher on improving inflation data and diminishing fears of recession. Among defensive assets, bonds (+4%) were the standout, while cash and credit were up slightly (+1%).
In equities, developed international markets delivered returns well above 20% for the year. The US Tech sector (Information Technology and Communications stocks) had exceptional 12-month returns as the large Nasdaq stocks continued to benefit from enthusiasm for AI. However, the market volatility of early August, when tech stocks pulled back by more than 10%, may indicate the inflated prices are not sustainable, and the promised benefits of AI may not be fully realised. Returns for exposures hedged against currency movements were the highest (+29%) as the Australian dollar appreciated in value as interest rate differentials narrowed following the Fed decision to cut the US cash rate.
The Australian sharemarket also posted a very strong 12-month return of 22%, more than double the average annual return for the last 30 years, as did Property & Infrastructure.
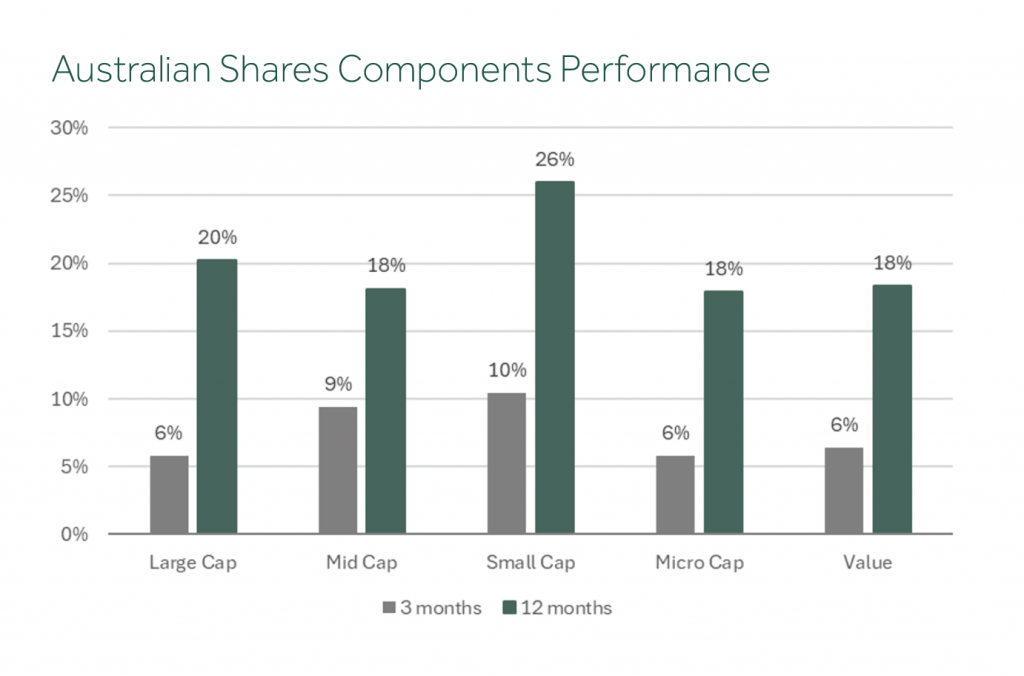
It is important to understand that ‘the market’ is more than the index. Within Australian shares, for instance, we can combine three broad components (or ‘factors’) to construct a well-diversified aggregate portfolio:
- Large companies (for broad market exposure),
- Value companies (those with cheaper relative valuations), and
- Mid/Small/Micro-Cap companies (those expected to deliver higher returns over time).
The evidence shows that each of these components behaves differently through time, and each plays its own role in performance and risk management. Through the investment cycle, we expect each to experience a different sequence of return. This opens up opportunities for investors to top up the underperforming components and take profits from the components that are performing well.
We know the Australian market is top-heavy with banks and miners. So we seek to manage risk and improve diversification in large caps by allocating equally across the industry sectors, rather than adopting the traditional market-weighted approach. This takes advantage of the less-than-perfect correlation between sectors, which can be seen clearly in the table below.
The top and bottom two sectors for each quarter of the previous year have been highlighted, the top ones in green and the bottom in red. You can see that the annual returns to September 2024 ranged from -17% for Energy to +58% for Information Technology.
For most of this year, the Australian market has been driven by banks, with the Financial Sector up 37%, and by IT (+58%) which is riding on the tailwinds of US tech momentum. Materials have been hampered by the poor performance of the Resource sector, which is tied to China’s slowing economy. However, in the last week of the quarter, the People’s Bank of China announced measures to bolster the real estate sector and the broader economy. While the China stimulus has broad implications across risk assets, the resources sector is one of the most immediate beneficiaries and has recouped some of its year-to-date underperformance on the back of rebounding commodity prices.
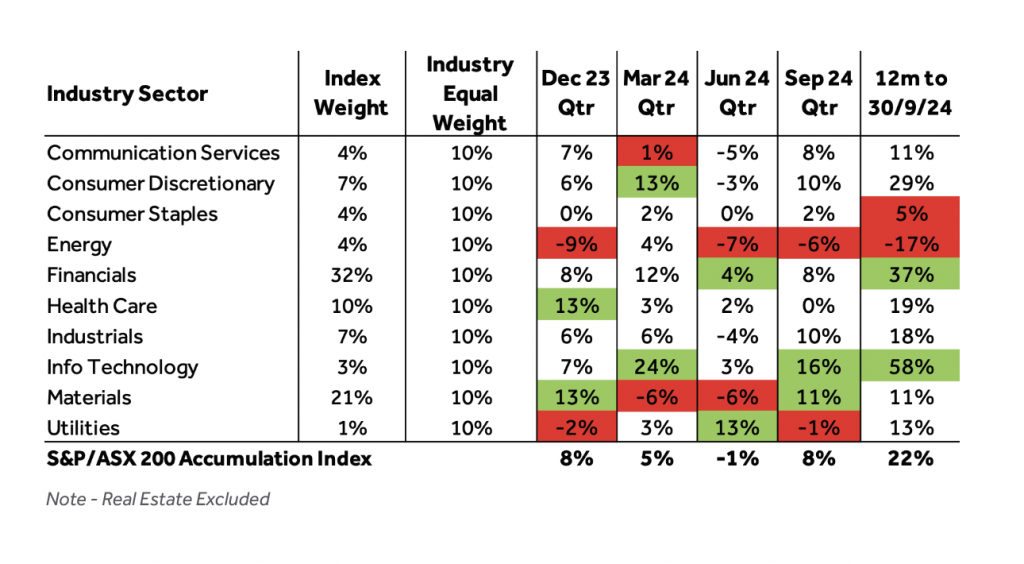
After Russia’s invasion of Ukraine more than two years ago, fossil fuel-linked sectors in Energy and Utilities powered ahead following several years of decline. However, that divergence between traditional and sustainability-focused portfolios reversed in the past year as Energy and Utilities were relatively weaker, while ‘cleaner’ (low carbon-footprint) sectors such as IT, Financials, and Consumer Discretionary led the market. Having said that, we still expect long-term returns from each approach will be similar, given our consistent underlying investment philosophy, but this again highlights the virtue of diversification.
Within defensive assets, Australian debt (hybrid securities) posted the best return in a decade (+5.7%) as did cash (+4.4%). Both asset classes benefit from higher interest rates, and hybrids from tighter credit spreads.
International debt (+4%) was the standout, benefitting from a decline in bond yields as the markets anticipate the future path for monetary policy and inflation expectations. The annual return was a very pleasing +9%, the highest in five years.
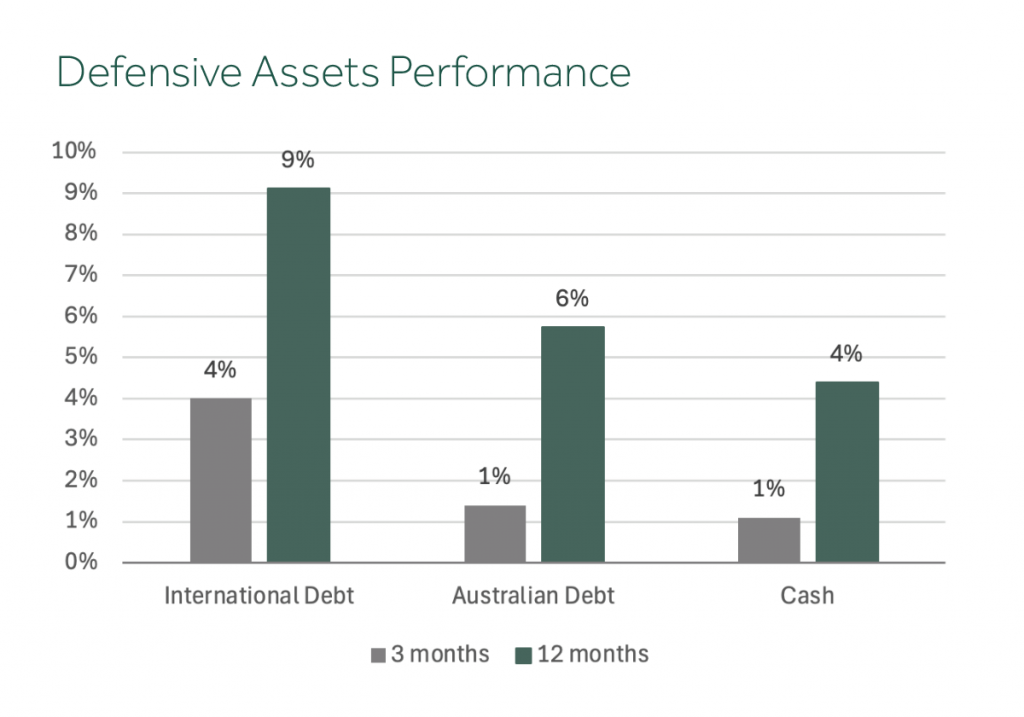
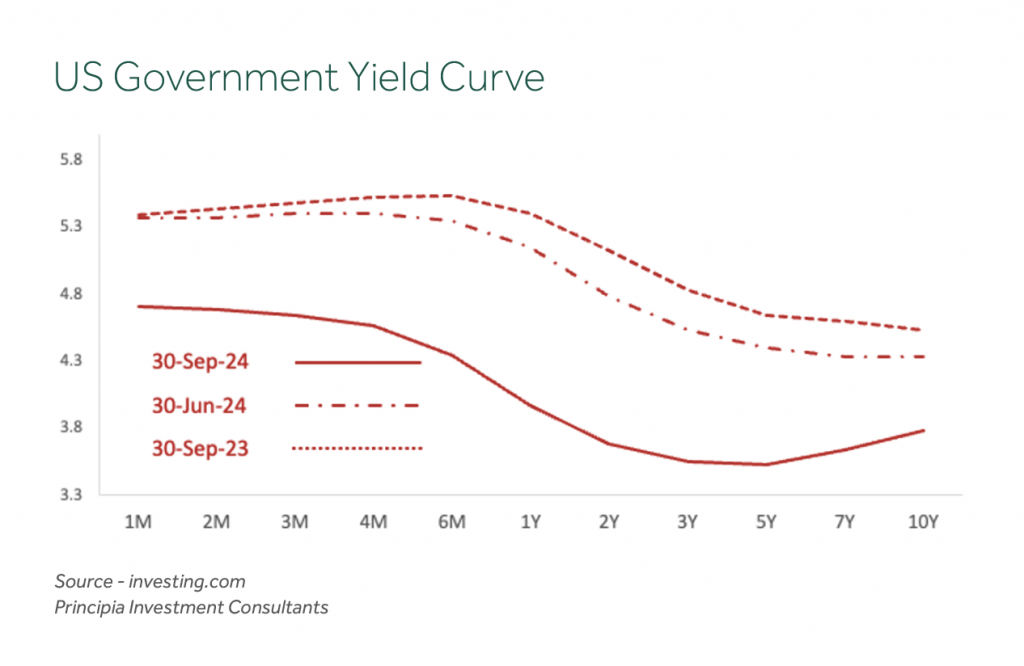
At the start of the year, the yield to maturity, or expected return, from bonds was 4.5%. So how did this asset class post a return of double this? The answer lies in the aforementioned decline in bond yields.
The US yield curve is dramatically lower since the start of the quarter, and even more so compared to a year ago. Bond prices are inversely related to changes in yield. So as yields declined, bond prices went up. Longer dated bonds are more sensitive to changes in yields than shorter dated bonds and so the impact of the decline, particularly for bonds with more than 5 years to maturity, drove the additional return.
For diversified portfolios, performance for the September quarter ranged from +5% for 50/50 growth/defensive allocations to +6% for 85/15 portfolios.
Annual returns for diversified portfolios to the end of September this year were double long-term averages and ranged from +15% for 50/50 portfolios to +20% for 85/15 portfolios.
In summary, the strong September coupled with the foundation established as the markets recovered from the selloff in September/October 2023 provided investors with the best period of returns since 2021. Spreading exposure across sectors, countries and asset classes paid off, highlighting the benefit of a systematic and diversified investment strategy.
While uncertainties over economic growth, inflation, interest rates and geopolitics continue to beset investors heading into the end of calendar 2024, the evidence-based and disciplined approach embraced by Minchin Moore remains the best protection against the unexpected.
Takeout Messages: The Lessons of Volatility
The return of significant volatility in early August has provided a useful reminder for investors everywhere that financial markets rarely move in one direction for long. In many ways, the sudden upsurge in volatility – the biggest since the onset of the pandemic – was overdue, so settled and uneventful had markets been for so long.
But we think you can use this past quarter to reinforce the hard-won lessons that Minchin Moore has been imparting to our clients for years.
First, a brief recap:
What Happened and Why
The events of early August are now well-canvassed. Low risk premia in major asset classes after an extended period of calm had made prices unusually sensitive to negative surprises.
That came in the form of softer-than-expected US jobs data, a spike in Middle East tensions and worries that the AI boom had gone further than fundamentals might justify.
Alongside this was a surprising pivot in monetary policy by Japan, whose central bank in late July raised short-term interest rates to 0.25%, the first increase in 17 years.
With the US Federal Reserve at that point signalling a rate cut was imminent there, we saw a sudden unwinding in the long-running ‘carry trade’, where investors borrow in yen at zero rates and seek higher-yielding assets elsewhere.
Days later, the Japanese equity market slumped 12% in a single session, its biggest one-day decline since the Black Monday crash of 1987. The VIX, the so-called ‘fear index’ of volatility on Wall Street, posted its biggest one-day rise in history.
But the turmoil was fleeting. By the third week of August, Wall Street had rebounded to register its best week of the year as economic data gave renewed confidence in a ‘soft landing’ for the US economy and as investors looked for Fed rate relief.
The US rate cut came in jumbo form in mid-September, fuelling the rally further and sending the S&P 500 to its 42nd record high of the year before the end of the quarter. In Australia, the S&P/ASX 200 also hit a record high late in the month.
What Happens Next?
That’s always the $64,000 question, isn’t it? Unfortunately, nobody has a reliable crystal ball. What moves markets most, as we have seen over and over, are the things that few people, if anyone, predicted. That’s the nature of how markets work.
What we can confidently predict is that markets inevitably will experience further periods of major volatility, and it will get uncomfortable again for investors.
The fact is that stock market corrections and periods of heightened volatility are a normal part of healthy working markets. Volatility tends to go up when uncertainty spikes, as we saw in August. That will happen again. When? We don’t know.
But then the ‘unknown unknowns’, as a former US Defence Secretary once described unseen events, are precisely why you have a plan that is made for you, and which can accommodate such periods via diversification, structure and discipline.
Focus on the Controllable
What you can do in these periods is to be wary of the factory settings that come with being human during uncertain times – this is the fight-or-flight mentality that prompts us to make irrational decisions to protect ourselves, only to make the situation worse.
For now, consider the following next time the market report hits the front pages of the newspapers or the top of the TV news bulletins:
- The average investor typically underperforms the market average. That’s because they sell and buy based on emotion, and at the wrong times.
- A short-term focus often compels investors to buy high and sell low and hold investments for less than five years, on average.
- Those who invest for the long-term and stay the course in the plan built for them typically earn significantly higher returns.
- For all their confidence, few pundits consistently and accurately predict economic and market outcomes. It’s not a sustainable way to invest.
- The media promotes bad news quite simply because bad news sells. Editors know we are hard-wired as humans to focus on the negative.
- But remember this: If somebody is selling, somebody else is buying. And they are often the people with a longer horizon than a few days or months.
- Ultimately, building wealth through financial markets is a bet on human ingenuity to innovate and solve problems. You can be part of that as an investor.
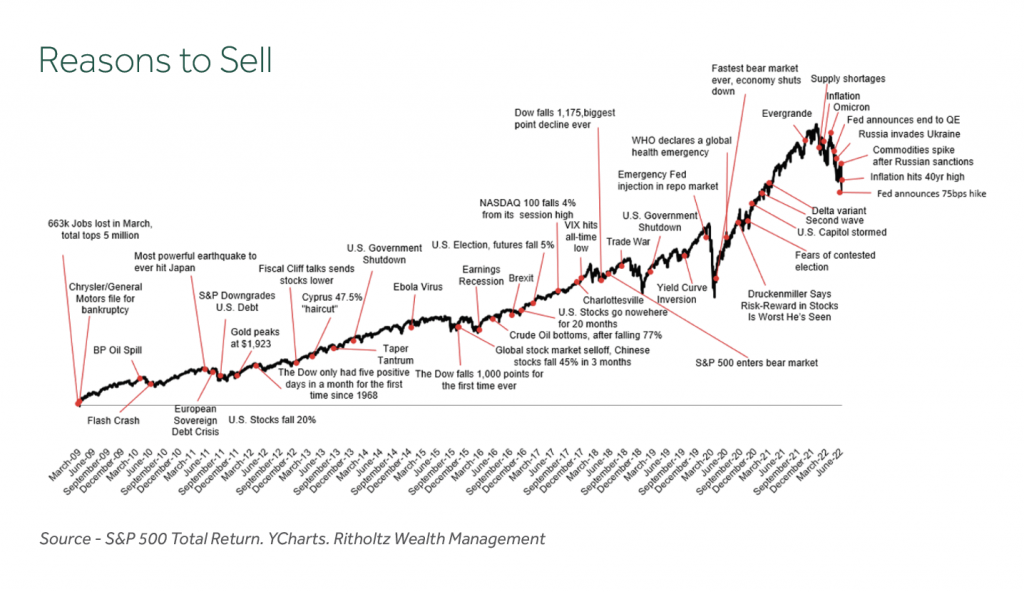
- And it works! While you can always cite reasons to sell, markets have tended to trend higher over the long term, as evidenced by the S&P 500 total returns from March 2009 to June 2022
What Should I Do Now?
Talk to us! That’s why we’re here. We know you. We know your goals and circumstances. We know the risks that you can live with and those you can’t.
No-one is saying you should give up on the news. Just don’t use the daily happenings in markets to direct your investment choices.
Think about why you are investing. You’re not trying to outguess where the market heads next month or next year.
But you do want to feel confident you have the plan in place to get you to where you want to go. We know how to do that, in good markets and bad.
That never changes.

