
For the past two years share markets have enjoyed relatively steady and strong growth, with only modest volatility. The pace of interest rate rises has tapered off, and economic conditions have felt somewhat more predictable again. This has been a welcome change, after a period of intense instability during the Pandemic.
Yet this week has seen the resurgence of volatility, with some big swings in markets. Media headlines have been filled with shock and awe. It is natural for this commentary to feed into our emotions, and often this triggers a negative feedback loop that fuels further market volatility.
It is precisely at these junctures that investors are well served to pause, breathe and pan out their view to look at a longer-term perspective.
At a Glance
What has been happening?
Markets have become volatile again after a long lull. Riskier assets like shares, commodities and cryptocurrencies are down, while there has been a rush to traditional safe havens like government bonds, and currencies like the Japanese Yen and Swiss Franc.
Why is it happening?
There are any number of explanations. First, a rise in US unemployment has fuelled perceptions that America’s central bank has kept interest rates too high for too long. Second, there is a view that the AI-related tech boom has overshot. Third, so-called ‘carry trades’ where hedge funds borrow in low interest-rate currencies like the Japanese yen and invest in higher-yielding ones like the Aussie dollar are being unwound. Finally, it is the northern hemisphere summer and thin volumes are exacerbating the swings.
What does it mean for me?
After a non-eventful period, the return of volatility can be unnerving, no doubt. But markets are volatile by nature. What happens in short periods tells us nothing about long-term returns. The underlying economic fundamentals are fairly sound, unlike in the time before the GFC. While no-one knows what the future will hold, the record shows that investors who stick with their plan and ride the ups and downs are better off.
What should I do in response?
As always, your first port of call should be your adviser, who knows you, your circumstances and your goals and who has crafted a plan to get you through rocky periods like this. In the meantime, try not to spend too much time doom-scrolling the news headlines. It’s good to stay informed, but not if it’s causing you unnecessary anxiety. Talking to your adviser and maintaining a long-term perspective are your best assets right now.
Volatility is Normal
What’s happened?
On Monday night, the S&P 500 (US stock market) finished down 3%, and on Monday our stock market was down 3.7%. These were big moves, but nothing compared to Japan’s stock market which lost 12.4% on Monday (albeit it is up over 10% today, at time of writing).
Notably the VIX volatility index – known colloquially as the fear index – has been trundling along below a reading of 20 for the best part of a year, but spiked to 65.65 ahead of Monday’s open. This was the third-highest reading behind the COVID-19 pandemic and the collapse of Lehman in 2008.
While equities have been selling off, big moves have also occurred in bond markets, where bond prices have been rising sharply (with yields falling). To put this in perspective, only a week and a half ago, US 10-year bonds were yielding 4.3%, and they are now sitting at around 3.8%. Whilst big moves like these in bond markets can feed anxiety, they also show that the bond market is working well again. Bond prices are factoring in likely lower rates in the future as the economy slows, and playing a balancing role in portfolios, with rising bond values offsetting declines in equities.
What is Driving the Volatility?
The sudden share market sell-off was sparked after July non-farm payrolls (unemployment) data was released in the US on Friday. The reading showed that the jobless rate in America had risen faster than expected. This in turn has fuelled fears of a potential recession in the world’s largest economy.
The US Unemployment Rate of 4.3% is now 0.9% above the cycle low which, occurred in April 2023 (3.4%). Historically, a recession has started on average three months before that 0.9% move higher in the Unemployment Rate.
Of course, any material correction in stock markets is generally fuelled by more than one datapoint, and other concerns likely fed into Monday’s reaction, such as:
- Middle East tensions
- The sense that the strong run in the big tech stocks was overdone (stocks like Nvidia, Microsoft, Apple, Amazon, Alphabet and Meta Platforms all sold off heavily on Monday).
- Growing scepticism about whether the $US1 trillion ($1.5 trillion) investment boom in artificial intelligence will actually generate decent returns.
Are we in for another Bear Market?
Nobody really knows if these recent events are the sign of things to come, or just a normal part of a healthy market having a breather. But most would agree that there doesn’t appear to be a structural problem with the US economy, as there was in 2008 when the housing market blew up. And unlike in 2000, the tech giants of today are fabulously profitable, monopolistic giants that will have very strong businesses with or without a boom in AI.
Periods of Volatility are Normal
Despite the stomach churning moves on markets over the past couple of days, it is worth remembering that stock market corrections and periods of heightened volatility are a normal part of healthy working markets.
It may surprise you that, in almost every year, the stock market typically encounters a significant correction. See the chart below, it shows returns the returns for the past 44 years on the US stock market (S&P 500). It also shows intra-year share market declines (red dot and number), as well as the market’s full calendar year return (grey bar).
S&P intra-year declines vs. calendar returns
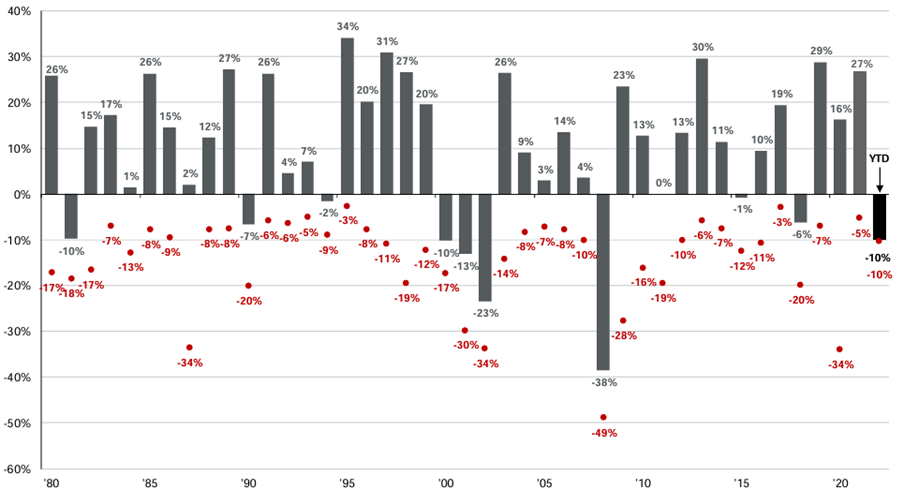
Returns based on price index only and do not include dividends. Intra-year drops refer to the largest market drops from a peak to a trough during the year.
Source: JP Morgan Asset Management
Over these 44 years on the US market, the average intra-year drop encountered was -14.2%, yet returns were positive in 33 out of 44 calendar years. The story is similar with the Australian stock market, see the chart below:
ASX 200 Index intra-year declines vs. calendar year returns
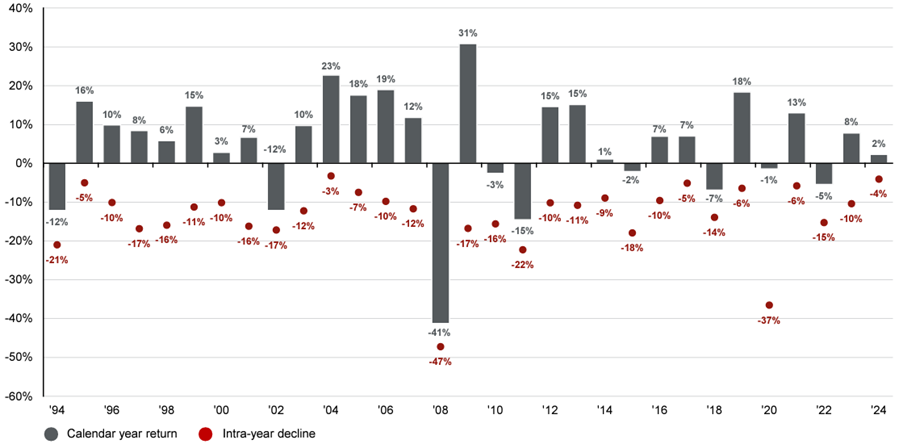
Returns based on price index only and do not include dividends. Intra-year drops refer to the largest market drops from a peak to a trough during the year.
Source: JP Morgan Asset Management
In Australia (above) annual returns were positive in 22 out of 30 years, despite average intra-year drops of 14%. Notably, significant drawdowns aren’t necessarily a bellwether for the next bear market. Most often, after the intra-year drawdown, we see a snapback recovery.
Beware of your Factory Settings!
When we read headlines like those we read this morning, we can naturally revert to our factory settings – our ‘flight or fight’ mentality. This can lead to irrational (and often poor) decision making in investments.
Remember:
- The average investor typically underperforms the market average. This is usually due to a lack of investment discipline, leading to investors selling and buying based on emotion, at the wrong times.
- A short-term focus often compels investors to buy high and sell low and hold investments for less than five years, on average.
- Those who invest for the long-term and stay the course typically earn significantly higher returns.
- Very few people can consistently and accurately predict economic and market outcomes. The ‘hit rate’ for professional forecasters and economists (including our own RBA) is very low!
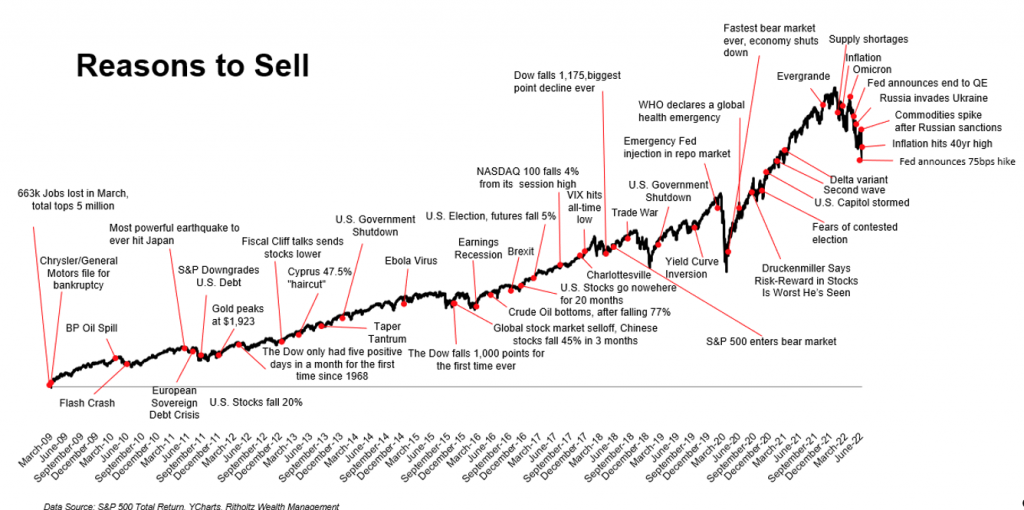
- We are hard wired to focus on the negative. We always seem to find a ‘reason to sell’…yet markets have tended to trend higher over the long term, as evidenced by the S&P 500 total returns from March 2009 to June 2022 (see chart below):
So, stay calm! Talk to your adviser if you need – that’s what they’re there for.
Remember why you invest. It probably is not to make a profit this week or month. More likely you are investing to generate a sensible long-term return that will support your own personal or family objectives and purposes.