
“The most fundamental problem of politics is not the control of wickedness but the limitation of righteousness” Henry Kissinger
Regardless of political creed or levels of interest, the one thing we can safely agree on is that the Trump presidency hasn’t been boring.
Comparisons with the 2016 presidential race are inevitable given Trump’s position in the polls both then and now. So, have we seen this movie before? Will Trump romp home again despite his “underdog” status?
Well, with two months to go it would be unwise to rule anything out as 2020 has shown that literally anything can happen, but rather than assume things are the same, let’s take a deeper look “inside the numbers” to see if we can spot any differences between 2016 and today.
Backgrounder: How do you “WIN” a US Election?
The United States Constitution of 1787 provides for an Electoral College (body of electors) to be formed every four years for the sole purpose of electing a President and Vice-President of the United States.
Each state is allocated two senators (“upper house”) and a number of representatives (“lower house”) based on the state’s relative population.
The representatives are often referred to as “congressmen/women” as they represent a portion of their state known as a “congressional district”. The 2010 Census averaged approximately 711,000 people per representative.
The sum of these two numbers (senators and representatives) equals the total number of electors each state is allocated.
For example, California, as the most populous state, is allocated 55 electors (two senators and 53 representatives), whereas the lightly populated states of Alaska, Delaware, Vermont, Wyoming, Montana and both Dakotas have three electors each (two senators and one representative).
In total for the 50 states there are 100 senators and 435 representatives. There are a further three college votes allocated to Washington DC, making 538 the total number of votes available.
With 538 votes available an absolute majority of 270 votes is required to win the election.
The Constitution allows each state the flexibility to determine how they allocate their votes, but in practice since 1824 most states appoint their electors on a winner-take-all basis as determined by the state-wide popular vote on Election Day. So whether a state is won by a margin 0.1% or 30%, the number of college votes received is the same.
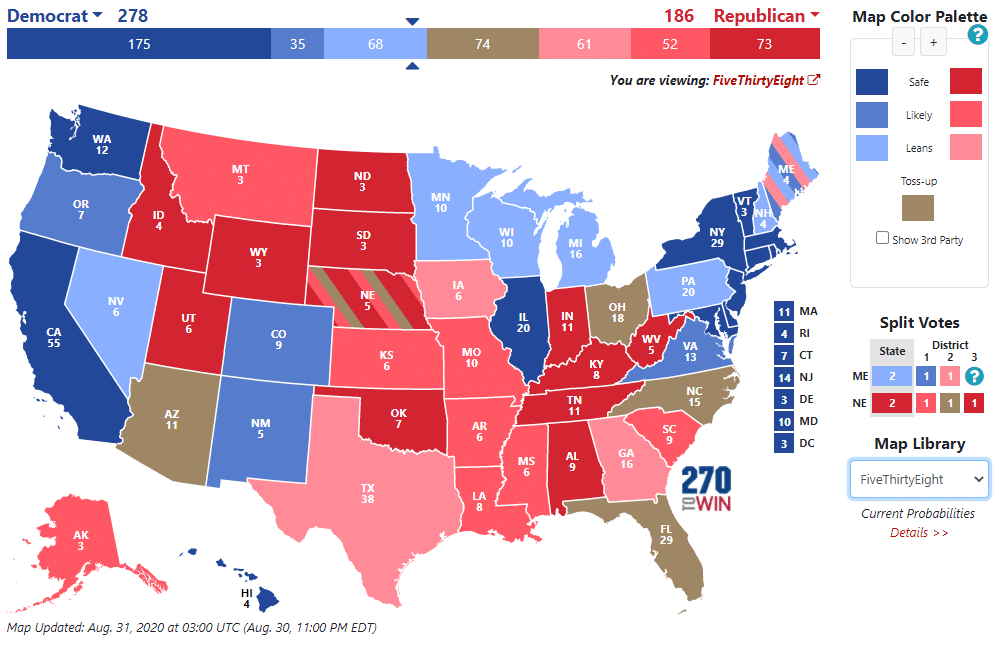
The only states that don’t do it this way are Maine (since 1972) and Nebraska (since 1996) who use the congressional district method (winner of the popular vote in each district, plus the remaining two votes (essentially the senators) to the winner of the state-wide vote. This is why you might see say “Maine (District 2) mentioned in the press as opposed to the overall state itself (and why they have the interesting stripes running through their state – graph below).
USA 2020 Election as at 31 August 2020 (State numbers are College Votes)
Popular Vote vs Important States
Now that we understand that the main game is securing 270 college votes, it can be seen that winning the overall “popular vote” or aggregate number of votes across the country is helpful but not necessarily enough. In recent times both Trump [2016] and Bush [2000] actually lost the popular vote but won enough states to claim the requisite 270 college votes.
With winning states being the key, important states begin to emerge that are either: a) large, b) hotly contested or c) have a great track record of voting for the winner.
The terms ‘swing state’ or ‘bellwether state’ are often used interchangeably but they can be quite different. A swing state means that the popular vote is likely to be very close (and can change from election to election) whereas a bellwether state has a history of correctly reflecting the nationwide vote (whether by history, representative demographics, or chance). Let’s step through a few examples.
Swing States
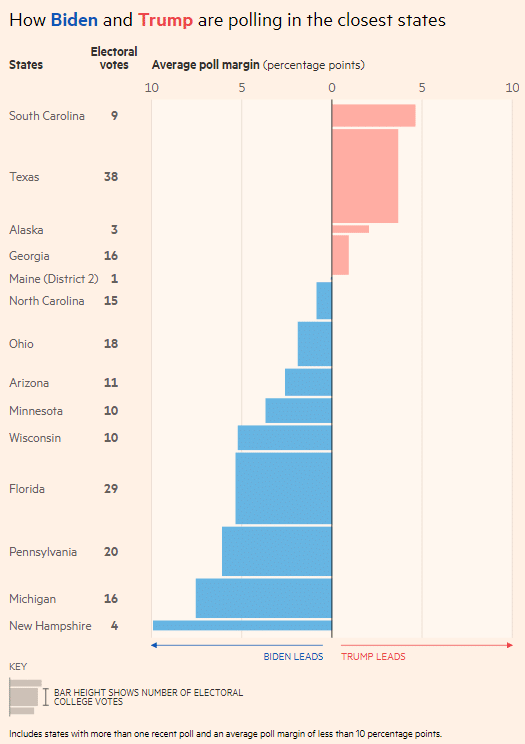
Given not all votes being equal under an electoral college system, swing states become really important, and large swing states even more so. Let’s look at Texas (38 votes). From 1872 through to 1976 it was predominantly a Democrat state, but has been Republican since 1980 (2 servings of Bushes helped) and Trump won by 9% in 2016. The burgeoning Hispanic population makes the net population growth a fascinating dynamic here and at a current margin of 3.5% (Trump), it now sits in the “toss-up” category for this election. It is also projected to pick up another 4 college votes after the next Census (2020).
Below is a graphic of the swing states with a couple of the larger ones like Georgia (16 votes, Trump ahead by 1%) and North Carolina (15 votes, Biden ahead by 1%) on razor thin margins.
Bellwether States
With 2 “misses” since 1896 (1944 and 1960), the undisputed king of the bellwether states is Ohio, carrying a not unimportant 18 college votes. Trump won by a resounding final margin of 8% in 2016 (the polling lead changed four times) after Obama had won by 4.6% and 3.0% in 2008 and 2012 respectively. Interestingly, the polling data at the State level appears quite light, but what has been done indicates Biden is ahead by 2.3%.
Its almost legendary ability to select a winner has entered popular culture, “Billions” fans may remember the great line from an unimpressed Chuck Jnr to his father during his NY gubernatorial campaign – “You’re delivering me Schenectady Dad, not Ohio”.
Swing & Bellwether States
What if you are both, like Florida? Equal third with New York on number of votes (29), and on a knife-edge – Florida really matters. Obama won 2012 by 0.9%, and Trump won 2016 by 1.2%. Current polling has Biden in front by 3.7% after being behind in April, but clearly way too close to call and is a “tossup” state. Further, Florida is second behind Ohio in the bellwether stakes as well, having only missed 1960 (Nixon instead of Kennedy) and 1992 (Bush instead of Clinton) since 1928. Clearly, winning Florida will go a long way to securing the presidency.
The other state that deserves a mention here is Pennsylvania. The sprawling twin metropolises of Philadelphia and Pittsburgh give it a crucial 20 votes (equal 4th with Illinois). Trump won this state in 2016 by 0.7% and it is a tossup in this election as well. Interestingly, it doesn’t rank that highly for all-time bellwethers, but it’s record since the 1960’s has been excellent, only incorrectly staying Democrat during the Bush junior years. Today’s margin of 5.5% (Biden) technically places Pennsylvania outside “swing state” definition (5%) but it is worth noting that it has been well inside that margin during this campaign and may well move there again.
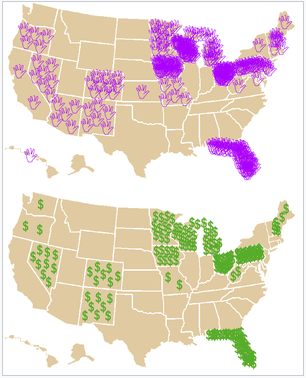
So, both swing states and bellwether states are important for different reasons, but if a state becomes both, it becomes vital. Needless to say, the politicians know this. The below chart maps a personal visit (hands) or $1m of advertising ($) in the preceding 5 weeks before the 2004 Bush/Kerry election, and it speaks for itself.
Bush/Kerry – Campaign Visits and Spending in last 5 weeks
Polling
History has shown us that we can’t trust the results of one poll, or even a series of randomly selected ones. Comparing polls is difficult as questions are non-standardised and asked at different points in time. There can be accidental biases in sampling (calling homes during the day). And that’s before we get into the undeniable partisanship of the various polling outfits themselves (Fox News v ABC News for example).
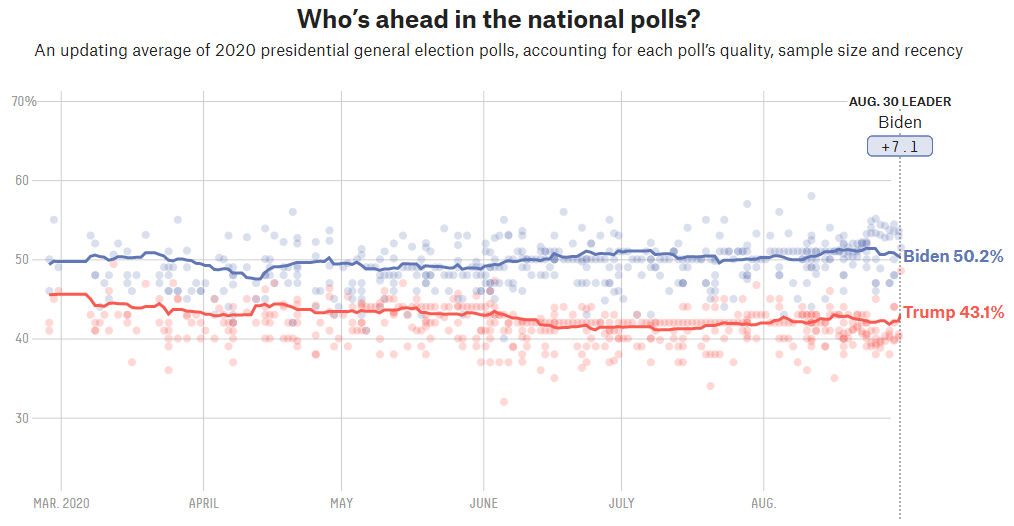
We believe it is more instructive to look at the averages of polls, and there are poll aggregators that do just that. These are clever outfits that have a sophisticated and continuously evolving processes aimed at delivering the most accurate snapshot possible at any point in time.
Some dismiss polls as a waste of time because they “got 2016 wrong”. But to be fair, and as we have seen, where there are a number of swing states ‘on a knife’s edge’, small changes on the day can lead to big changes in the outcome. So its not so much that the pollsters aren’t good at what they do, it’s more that the job can be very difficult.
Some of the polls gave Trump a circa 30% chance on the morning of the 2016 election. Given where he was polling the night before, it could be argued that assigning that chance was pretty impressive.
Owning and operating these aggregators is a huge business, and they are doing everything they can to stay relevant. Here’s the two biggest names, and what their averages currently show. (There is a plethora of information on their websites about their methodologies if you are interested)
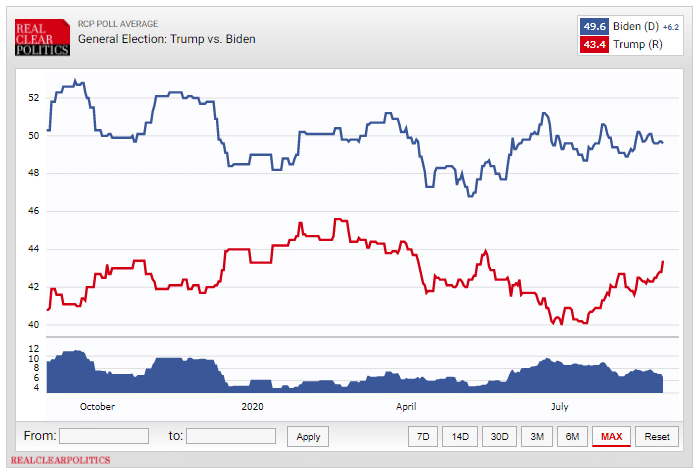
Real Clear Politics (RCP)
Formed in 2000 by former options trader John McIntyre. They aggregate the polls to create averages which are widely used (the FT uses their data to drive their “predictive” model, for example). Their website displays the results of all polls conducted and uses a proprietary decaying formula that places more emphasis on recent results. The best estimation here is that RCP are a mildly conservative organisation and could be considered ‘slightly right of centre’.
FiveThirtyEight (538)
Launched in 2008 by Nate Silver (author of The Signal and the Noise) and shot to prominence during the 2012 election when he correctly predicted the result of all 50 states (including all 9 “swing states”). What was interesting was the way Silver ranked pollsters by accuracy and then weighted them accordingly. The best estimation here is that they are a mildly liberal organisation and could be considered to be ‘slightly left of centre’.
Given we can get a blend of ideologies and methodologies, keeping an eye on both of these should prove useful.
Facts we can Decipher
So now we know how an election race is won and a bit about polls and polling aggregators. From this we can draw two related facts when comparing this election to 2016.
Fact 1 – “There are fewer undecideds in 2020 than there was in 2016”
2020 has a smaller number of “undecideds”. Even on the eve of the 2016 election, only 90.4% indicated that they were committed to voting one way or the other. 2020 has 93% committed as at today, higher than any stage of 2016.
Fact 2 – “Biden has a higher support base than Clinton did in 2016”
Clinton only polled 50% (intent to vote for her) or better once in 2016 and that was in April. From then she oscillated between 44%-48% – good enough to be “favorite”, yet within the famous 3-4% pollster margin of error, and crucially, vulnerable to a disproportionate late swing away from her by the undecideds, which is what happened. By contrast, Biden over the same period has been more like 48-51% – better numbers with (and because of) fewer undecideds.
Popular theories, also known as “Non-Facts” (& an impartial assessment thereof)
For Biden
Theory: The “shy” Trump voter won’t turn up this time. Also known as the “country club” guy, or “the guy who didn’t tell his wife who he voted for”.
• Assessment – potentially true but anecdotal at best.
Theory: Obama’s “first time voters” (who were predominantly black) were a no-show for Clinton but love Biden.
• Assessment – potentially true but anecdotal at best.
Theory: Florida’s aging population think Trump has mishandled Covid19 and there will be a backlash
• Assessment – there is no current evidence to support this theory
For Trump
Theory: Knows how to win from an underdog position.
• Assessment – 2016 was won from an underdog position. In this election he is now an underdog, having been favorite earlier in the campaign.
Theory: If postal votes are cancelled or constricted this helps Trump enormously.
• Assessment – there is no evidence to suggest that postal voters would lean one way or the other.
Theory: Incumbents enjoy a late positive shift in the polls, even on election day.
• Assessment – this has certainly happened some of the time.
Theory: Republicans are good for the economy.
• Assessment – long term studies have shown that there is no clear evidence to suggest that either party can do a better job with managing the economy.
Who is the rest of the World hoping wins?
A quick initial cut could split camps by the strength of their populism. A win for Trump would further legitimise Brazil’s Bolsonaro and the Phillipines’ Duterte but likely bring despair to New Zealand’s Ardern and Canada’s Trudeau.
Others are less clear-cut. It would appear that the Kremlin favoured a Trump win in 2016 and we suspect not much has changed. If the perception is that the US is less stable under Trump then that would be thought of as an asset. China could potentially be in the same camp, despite the geopolitical sabre rattling, but it could be easily argued that they would prefer a less volatile world stage to conduct global trade.
And what of Australia? We suspect if the popular vote was held here that Biden would win – but it may be closer than most people think.
What will the result mean for my portfolio?
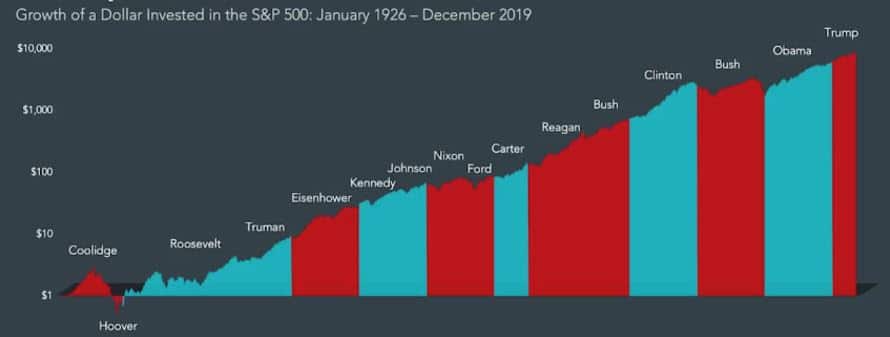
Often, election forecasts are made or listened to with the intent of taking a particular position based on the predicted outcome. For example; there is a widely held belief that the election or reelection of a Republican President will provide a lift to the stock market.
Minchin Moore clients know all to well that we can’t “predict the future”, but what if we somehow did know – would it make any difference? Would some combination of stocks, bonds, property and alternatives do better under one winning candidate than another? The evidence suggests the answer to this question is “no”. There is no tangible evidence to suggest that one could profit even if the result was known in advance.
The chart below shows the US stock market performance since 1926 and suggests the correlation between ruling party and S&P500 performance is close to zero.
So to finish, there is a wealth of information out there to avail yourself of if you are so interested, but to mangle a government ad from 2001, “Be informed, but not alarmed”.