Global Markets Summary
Global developed market stocks posted their sixth straight quarter of gains in the third quarter, with many indices hitting record highs in August before easing off in September.
Currency movements made a significant impact, with a broadly weaker Australian dollar helping unhedged Australian investors with offshore equity exposure.
Dominating news headlines was a surge in the more virulent Delta variant of the coronavirus, with renewed lockdowns in many countries, including Australia and NZ, denting expectations for economic recovery.
Also topical were questions about the timing and extent of central bank moves to reduce policy stimulus. The RBA gave notice it planned to keep its cash rate at 0.1% until 2024. In the US, the Federal Reserve pointed to a likely tapering of its bond purchases later this year and a rate increase in 2022.
Another talking point was a spike in inflation in many economies, due to pandemic-related disruptions to supply chains and higher energy prices. The Australian inflation rate rose to a 13 year high in the June quarter.
Energy stocks were among the best performers in Q3 as resurgent demand and low stockpiles pushed coal, oil and gas prices higher. However, China’s reduction in steel output hit iron ore prices, which hurt many materials stocks. REITs performed broadly in line with global developed equity markets. While emerging markets fell over the quarter, developed markets recorded positive returns of close to 4%. The Australian market, having hit a record high in August, ended about 1.8% higher for the quarter.
Premiums were a mixed bag. The small cap premium (the extra return smaller companies deliver in aggregate compared to large companies) was positive in Australia, but negative elsewhere. The value premium (for companies with low market valuations relative to the book value of their assets) was positive in Australia and in emerging markets, but mixed elsewhere.
The Australian dollar was broadly weaker against major currencies over the quarter. On bond markets, the quarter was marked by a negative term premium and neutral credit premium overall.
What Dominated the News
The following news summary is not intended to explain the markets’ performance in the quarter, but to provide some perspective about what dominated headlines:
July
- Global death toll from COVID-19 reaches four million
- Olympic Games open in Tokyo after year’s delay; Brisbane awarded 2032 Games
- RBA announces first step toward tapering its bond buying program
- US Federal Reserve defends continued policy support even as inflation spikes
- Economists warn of threat to global recovery from growing Delta strain
August
- Scientists reach ‘unequivocal’ consensus on global warming in IPCC report
- Taliban forces enter Kabul; declare 20-year Afghanistan war over
- Australian banks, flush with excess capital, unveil record share buybacks
- Global equities hit record highs as fears of imminent Fed taper ease
September
- US, UK and Australia form trilateral security pact to counter China
- Markets brace for possible default of property giant China Evergrande
- US Federal Reserve flags bond taper plan in November; rate hike in 2022
- German political parties haggle over coalition to take reins from Angela Merkel
- EU postpones trade talks with Australia amid submarines deal anger
Portfolio Movements
The September quarter delivered subdued returns across all the major asset classes, particularly the Defensive Assets of Cash, Australian Debt, and International Debt. Australian Shares, International Shares, and Property & Infrastructure eked out small positive returns, with unhedged exposures benefitting from the declining Australian Dollar. Performance for the quarter across diversified portfolios ranged from 0.9% for 50/50 Growth/Defensive portfolios to 1.5% for 80/20 portfolios.
The year ended 30 September 2021 presented many opportunities for systematic portfolio rebalancing between asset classes (i.e. topping up hardest hit asset classes, and selling down those most resilient). During this period, returns from Growth Assets were well above long term return expectations, being above 30% for all the major asset classes. Returns from Defensive Assets were closer to zero. This meant that returns for diversified portfolios ranged from 15% for a 50/50 portfolio to 23% for an 80/20 portfolio: close to 3 times the long term expected returns. Portfolio Rebalancing has focused on harvesting these exceptional returns through profit taking in Growth Assets and reinvesting into Defensive Assets, which are expected to provide a buffer against future declines in Growth Assets should they occur.
Australian Shares, Portfolio Strategy
Within Australian Shares we combine three broad components to construct a well-diversified aggregate portfolio:
- Large Companies (for broad market exposure),
- Value Companies (those with cheaper relative valuations), and
- Small Companies (expected to deliver higher returns over time).
Each of these three sub-categories behave differently through time, and each plays a role. Through the investment cycle we expect each to experience different sequencing of return, leading to opportunities to top up the underperforming components and take profits from the components that are performing well.
Over the last 12 months we’ve seen numerous divergences between the performance of the three components. Value companies have had one of their strongest ever years, after experiencing one of the worst periods of relative performance in history. Small Companies were next best, around in line with the S&P/ASX 200 Index, and Large Companies lagged.
Our ‘Industry Equal Weight’ approach to the selection of direct Australian shares continued to provide diversified sources of returns and experienced a similar rotation of sectors driving returns. The performance of the Industry Sectors varied through the year as shown in the table below (the top and bottom two sectors each quarter have been highlighted).
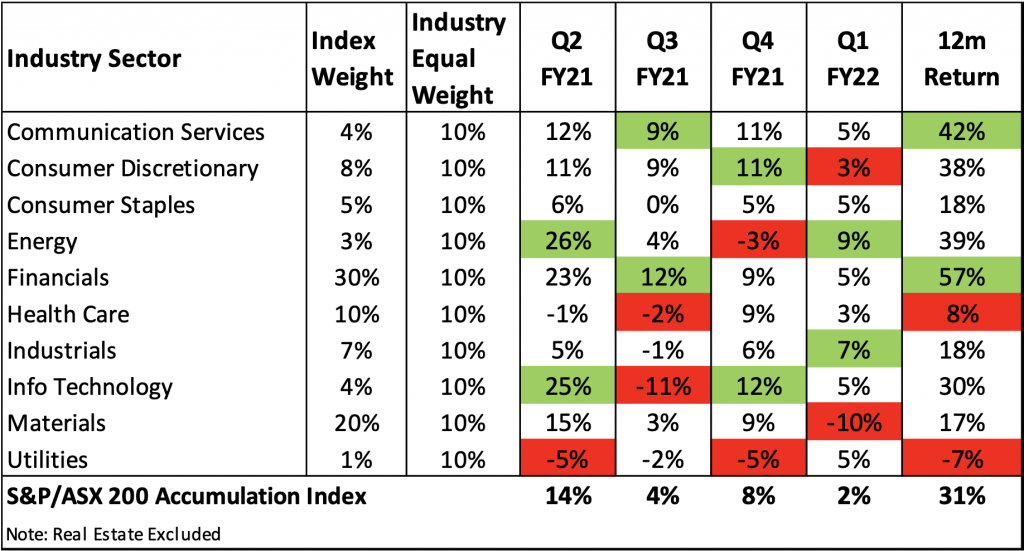
Our approach seeks to manage risk and improve diversification by allocating equally across the Industry Sectors, rather than adopting the traditional market weighted approach. This method takes advantage of the less than perfect correlation between the Industry Sectors, which can be clearly seen in the table. Through the business cycle there are periods when each sector delivers superior returns and periods when they underperform. This variation in return provides opportunities to harvest returns from outperforming sectors and add to exposures in underperforming sectors at depressed prices.
Bonds and Rising Interest Rates
The decline in developed world interest rates to historic lows in recent years has led to anxiety among Australian investors about what will happen to their fixed interest holdings when overnight interest rates begin to rise. This apprehension is based on the widely held view that longer-dated bonds are prone to underperforming in rising interest rate environments. But is this assumption correct?
As investors wait for the “inevitable” rise in short-term interest rates, it may be timely to re-visit the question of bond performance in a rising interest rate environment.
Let’s re-visit periods over the last 30 years where US interest rates have risen meaningfully over a 12 month period and see what effect this had on a portfolio of global bonds, hedged to AUD. For this analysis, we used the US Federal Funds rate as a proxy for US interest rates. To meet the definition of a rising interest rate environment, the increases had to be spread out over 12 months or more and the cumulative increase had to be at least 1.5 percentage points. Now we compare the Australian Bank Bill Index (a proxy for Australian cash) to the Barclays Global Aggregate Bond Index (hedged to AUD) (a proxy for the broad global bond market) to see how longer dated bonds performed relative to cash in these periods.
Table 1. Periods of Rising US Rates since 1990
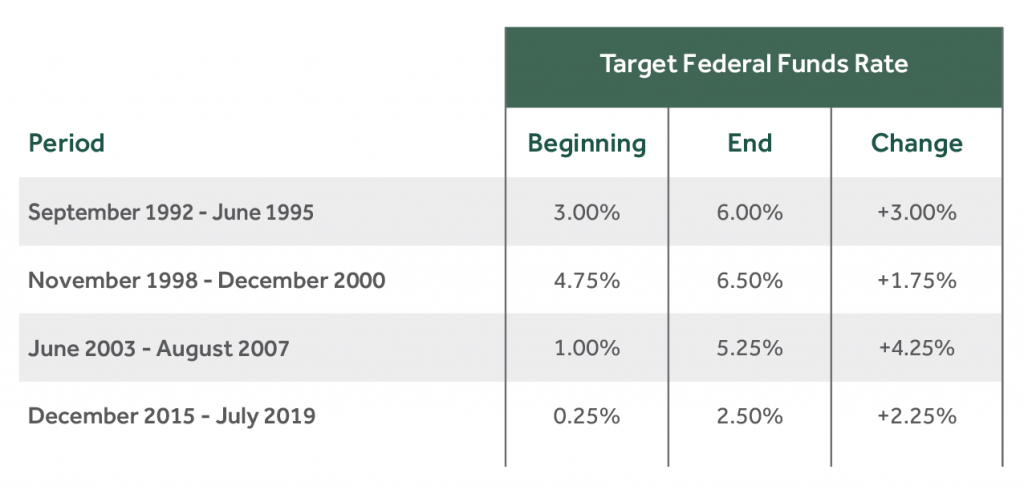
Figure 1. Relative Performance, annualised, during periods of rising US Rates
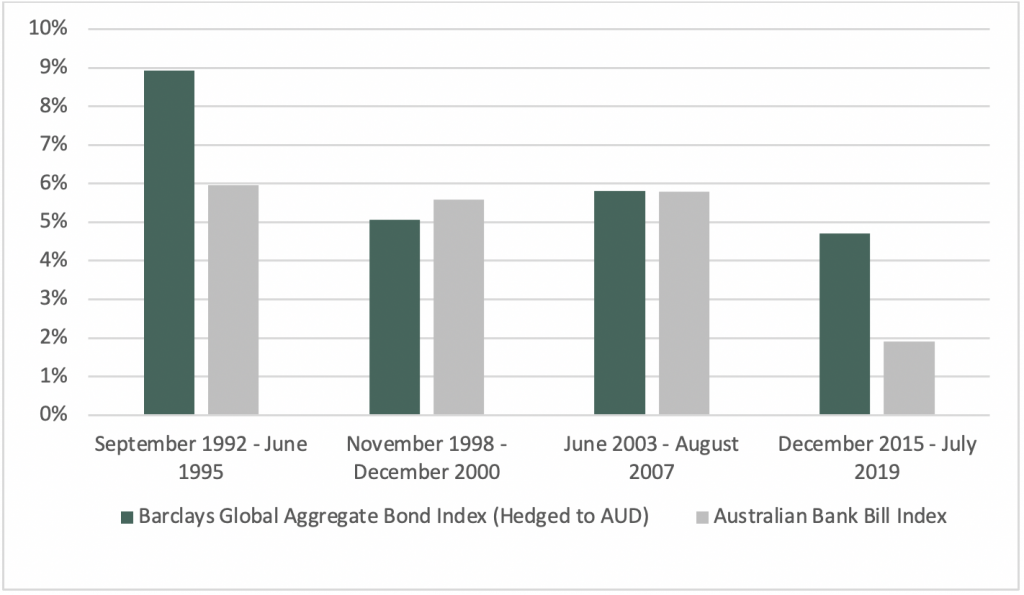
In the first and most recent periods we can see that the longer-term bonds outperformed bank bills. In the second period, the results are reversed – cash did better than the longer bonds. It is worth noting that while the bond market underperformed cash, it still returned a healthy plus 5% over this period. In the third period, cash and bonds returned around the same, and in fourth and most recent period (with the starting rate similar to the current rate), bonds comfortably outperformed cash. What do we conclude? Based on these four samples, we have positive returns in all cases, and two wins for longer bonds, one loss and a draw relative to cash. The point is, on the historical evidence we have, we cannot say that when interest rates are rising longer bonds will do worse than cash.
What does this mean for investors?
The market values of bonds rise and fall on changing expectations for inflation and interest rates, shifting perceptions about the creditworthiness of individual issuers and fluctuations in the general appetite for risk. The yield on a bond is the inverse of its price. If the price falls, it means investors are demanding an additional return – a higher yield – to compensate for the risk of holding the bond. So, while it might seem intuitive that rising interest rates mean lower returns from bonds, there are some important points that bond investors should keep in mind.
- A change in interest rates – by which we mean the official overnight cash rates that central banks set – does not mean that longer term yields (which affect the value of bonds) will move exactly in unison.
- It is extremely hard to accurately forecast changes in yield with any consistency (even if we are “absolutely certain” that a central bank will change their official cash rate). Standard & Poor’s regular scorecard shows most managers fail to outpace bond benchmarks over periods of 5 years or more.
- In the current environment there is no guarantee that rates will rise any time soon. Outbreaks of covid mutations may result in a return to restrictions on human movement and economic growth may be curtailed, pushing out the timing of rate rises.
- Finally, if you look at history, it has not always been the case that longer-term bonds have underperformed shorter-term bonds when short-term interest rates are rising.
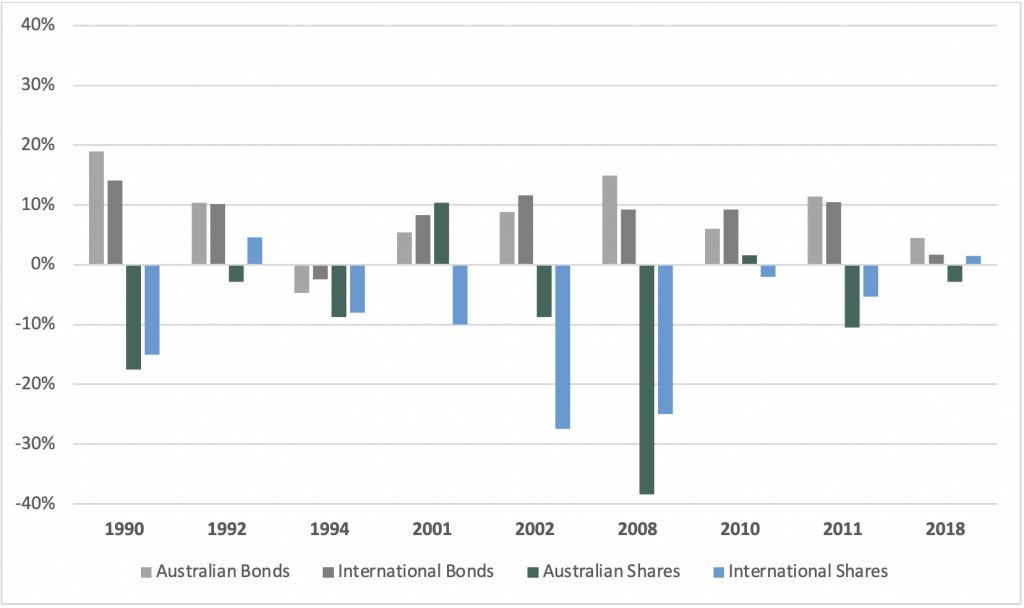
When it comes to a portfolio’s fixed interest allocation, then the best course of action may be to hold the line. Remember that the primary role bonds perform in a portfolio is to diversify the risks associated with growth assets, particularly shares. Bond are not the return engine of a portfolio – they are a defensive asset class and provide a ‘buffer’ within portfolios in periods of equity market stress, as shown in Figure 2.
Figure 2. Performance of Bonds During Periods of Equity Market Stress
Impact of Rising Inflation on Returns from Shares
Many investors are concerned whether stock returns will suffer if inflation keeps rising. Here’s some good news: Inflation isn’t necessarily bad news for stocks. A look at equity performance in the past three decades does not show any reliable connection between periods of high (or low) inflation and Australian stock returns.
Since 1991, one-year returns on stocks have fluctuated widely. Yet the weakest returns can occur when inflation is low, and 23 of the past 30 years saw positive returns even after adjusting for the impact of inflation.
That was the case in the first six months of 2021 too. Over the period charted, the ASX 300 posted an average annualised return of 7.7% after adjusting for inflation.
Figure 3. Average annual real returns in years for Australian Shares 1991 to 2020

Source: Dimensional Fund Advisors